Comparative Study
. 2010 Apr 1;5(4):e9965.
doi: 10.1371/journal.pone.0009965.

Quantification of rapid Myosin regulatory light chain phosphorylation using high-throughput in-cell Western assays: comparison to Western immunoblots

Affiliations
Comparative Study

Quantification of rapid Myosin regulatory light chain phosphorylation using high-throughput in-cell Western assays: comparison to Western immunoblots

Hector N Aguilar et al. PLoS One. .

Abstract

Background: Quantification of phospho-proteins (PPs) is crucial when studying cellular signaling pathways. Western immunoblotting (WB) is commonly used for the measurement of relative levels of signaling intermediates in experimental samples. However, WB is in general a labour-intensive and low-throughput technique. Because of variability in protein yield and phospho-signal preservation during protein harvesting, and potential loss of antigen during protein transfer, WB provides only semi-quantitative data. By comparison, the "in-cell western" (ICW) technique has high-throughput capacity and requires less extensive sample preparation. Thus, we compared the ICW technique to WB for measuring phosphorylated myosin regulatory light chain (PMLC(20)) in primary cultures of uterine myocytes to assess their relative specificity, sensitivity, precision, and quantification of biologically relevant responses.

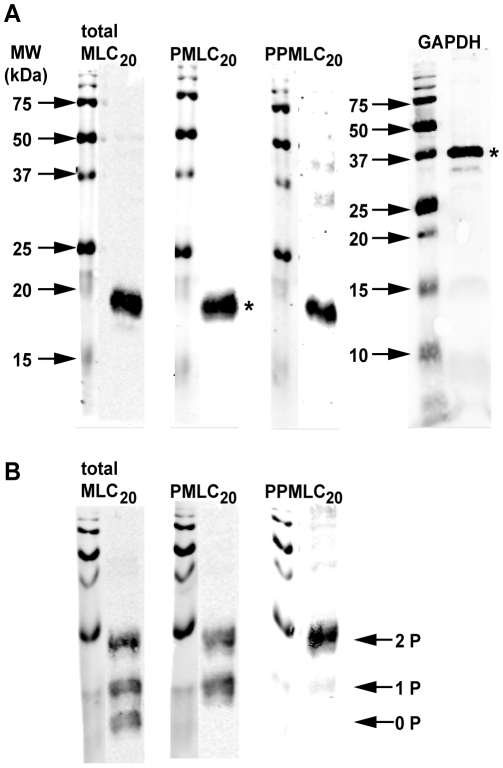
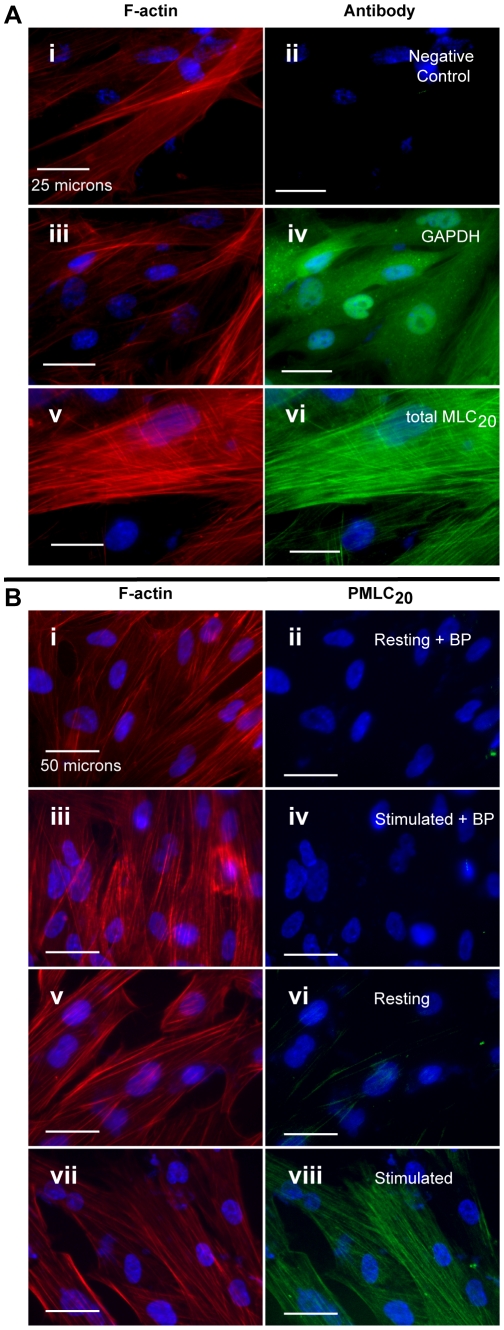
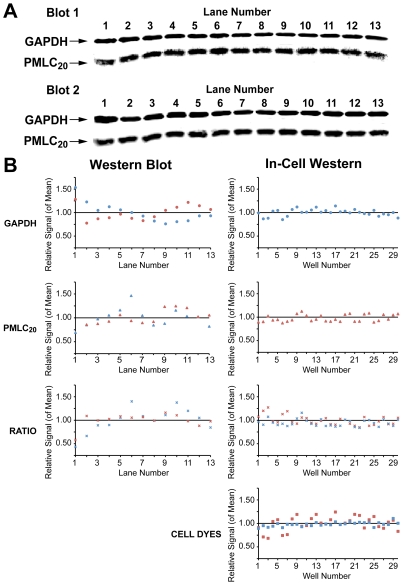
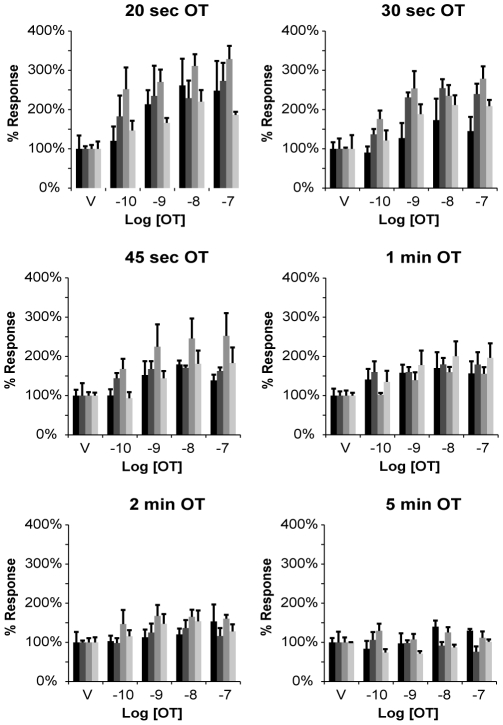
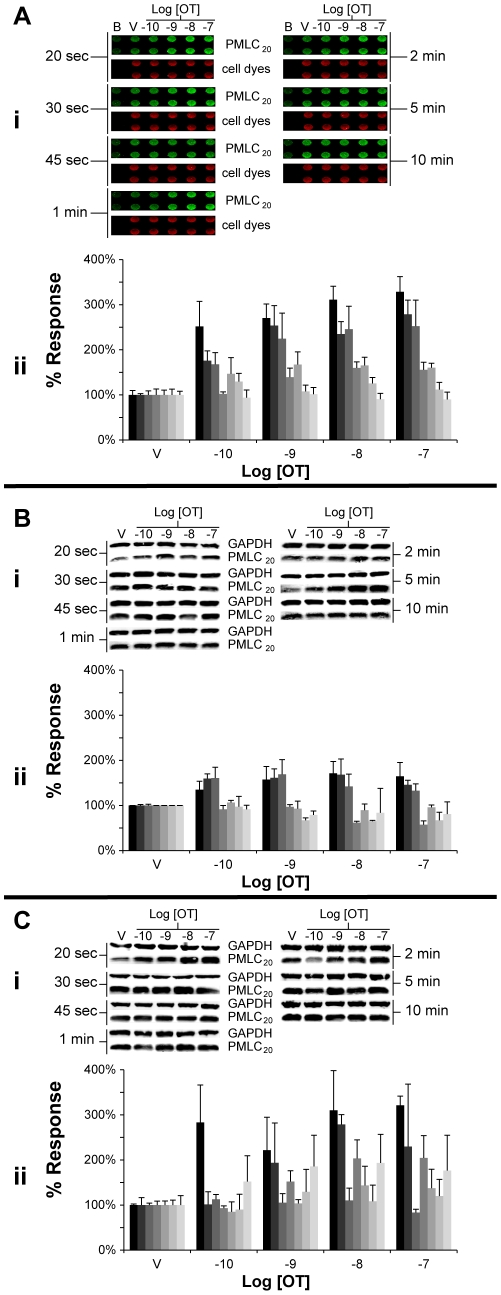
Methodology/principal findings: ICWs are cell-based microplate assays for quantification of protein targets in their cellular context. ICWs utilize a two-channel infrared (IR) scanner (Odyssey(R)) to quantify signals arising from near-infrared (NIR) fluorophores conjugated to secondary antibodies. One channel is dedicated to measuring the protein of interest and the second is used for data normalization of the signal in each well of the microplate. Using uterine myocytes, we assessed oxytocin (OT)-stimulated MLC(20) phosphorylation measured by ICW and WB, both using NIR fluorescence. ICW and WB data were comparable regarding signal linearity, signal specificity, and time course of phosphorylation response to OT.

Conclusion/significance: ICW and WB yield comparable biological data. The advantages of ICW over WB are its high-throughput capacity, improved precision, and reduced sample preparation requirements. ICW might provide better sensitivity and precision with low-quantity samples or for protocols requiring large numbers of samples. These features make the ICW technique an excellent tool for the study of phosphorylation endpoints. However, the drawbacks of ICW include the need for a cell culture format and the lack of utility where protein purification, concentration or stoichiometric analyses are required.


Conflict of interest statement

Competing Interests: The authors have declared that no competing interests exist.

Figures

Figure 1
Figure 1. Signal linearity with western blots.
A. Tris-Glycine-SDS gels were loaded with total uterine myocyte lysate (2-fold dilutions from 50 µg to 1.6 µg). GAPDH, total MLC20, and phospho(Ser19)-MLC20 (PMLC20) were detectable with 1.6 µg total protein/lane. B. Quantification of bands shown in panel A. Normalized values are expressed as a fraction of the band intensity measured at 50 µg/lane. Fit of a linear model through the origin showed excellent correlation for all three proteins (GAPDH: •; MLC20: ▪; PMLC20: ▴). The inset graph illustrates the correlation coefficient when only the lanes with ≤12.5 µg protein are analyzed. Molecular weight markers (MW) are shown at the left.
Figure 2
Figure 2. Antibody specificity using western blots.
A. Full length western blots with single lanes loaded with 25 µg of protein/lane demonstrating the relevant bands (*) used for quantification in other experiments. Antibodies against GAPDH, total MLC20, PMLC20 and diphospho-MLC20 (PPMLC20) each identified one prominent band, though faint “non-specific” bands appeared with the anti-GAPDH and anti-PPMLC20 antibodies. B. Western blots performed as in panel A but with the addition of phos-tag (30 µM) to the gel matrix to promote mobility shifts in phosphorylated proteins. Probing for total MLC20 reveals 3 bands corresponding to unphosphorylated (0 P), mono-phosphorylated (1 P), and diphosphorylated (2 P) MLC20. The anti-PMLC20 antibody reacts with mono- and diphosphorylated MLC20 and fails to recognize the unphosphorylated species. The anti-PPMLC20 antibody recognizes primarily diphosphorylated MLC20 and demonstrates almost no cross-reactivity with the unphosphorylated or mono-phosphorylated MLC20. Molecular weight markers (MW) are shown to the left of each blot.
Figure 3
Figure 3. Signal linearity with the in-cell western assay.
A. 96-well microplates were loaded with an increasing number of cells/well. Signals from anti-GAPDH and anti-PMLC20 antibodies appear as green fluorophores. Signals from cell dyes (cell number normalization) appear as red fluorophores. B. Quantification of signals shown in panel A. Normalized values are expressed as a fraction of the signal intensity of the wells containing 15,000 cells for GAPDH (•), PMLC20 (▴). The signal from the cell dyes also is shown (▪). The GAPDH and PMLC20 signals appear to plateau at the higher cell densities so the line of best fit has been calculated and illustrated by expressing the normalized values as a fraction of the intensity of the wells containing 10,500 cells (inset) for GAPDH (•), and PMLC20 (▴).
Figure 4
Figure 4. Antibody specificity using the in-cell western assay.
In each pair of micrographs, the left panel illustrates filamentous actin (F-actin) stained with rhodamine-phalloidin (red). The corresponding right panels are immunofluorescence micrographs stained with antibodies conjugated to Alexa-Fluor 488 (green). Nuclei are stained with DAPI (blue) in all panels. Images are shown at 400× and 200× magnification in panels A and B, respectively. White bars represent 25 and 50 microns, respectively. A. Demonstration of GAPDH and total MLC20. Panels i and ii. The actin fibers stain in a filamentous pattern typical of uterine smooth muscle. There is no detectable signal with omission of the primary antibodies. Panels iii and iv. The GAPDH staining shows a diffuse cytosolic pattern in contrast to the fibrillar pattern of actin. Panels v and vi. Total MLC has a similar staining pattern to actin. B. Demonstration of PMLC20. Panels i–iv. There is no detectable background fluorescence when the antibody has been preadsorbed with blocking peptide (BP) containing phospho-Ser19 of MLC20, either in the resting state (panel ii) or with stimulation using 100 nM OT (20 sec stimulus, panel iv). Only a small amount of PMLC20 is detectable in the resting myocyte (panel vi) but this is markedly increased upon stimulation with OT (100 nM, 20 sec: panel viii).
Figure 5
Figure 5. Assessment of intra-assay variability in western blots and ICW assays.
A. WB membranes showing GAPDH and PMLC20 levels in 13 replicate samples in two western blots. B. In the panels on the left are the individual band intensities from WBs in A expressed as a proportion of the mean of the thirteen samples in each of the two blots. The data from blot 1 are shown in blue and from blot 2 in red. The data are provided for GAPDH and PMLC20 individually and for the ratio GAPDH/PMLC20. In the panels on the right are the intensities of the signals from wells distributed across ICW plates plotted as a proportion of the mean values for each of two plates (plate one in blue and plate 2 in red). The data are provided individually for GAPDH, PMLC20, and in the lowermost panel for the cell dyes used in data normalization. The ratios of GAPDH and PMLC20 to the cell dyes are also shown in red and blue, respectively.
Figure 6
Figure 6. Cell density optimization for the in-cell western assay.
Uterine myocytes were seeded at densities of 500 (darkest histogram in each grouping), 550, 600 and 650 (lightest histogram in each grouping) cells/mm2. Cells were treated with increasing concentrations of OT (10−10 to 10−7 M) for 20, 30, 45 or 60 seconds or 2 or 5 minutes (n = 4 at each time point at each concentration of OT). Concentrations of PMLC20 were measured using the ICW assay. PMLC20 levels rose rapidly (20 sec), decayed significantly by 1 min, and returned to baseline levels by 5 min. The largest amplitude concentration-dependent change in PMLC20 levels was measured at 20 sec and 600 cells/mm2.
Figure 7
Figure 7. Comparison between WB and ICW for cell responses to OT.
For each of the figures, the top panel (i) presents the raw data and the lower panel (ii) presents a graphical analysis of the normalized and quantified data (n = 2–4 for each histogram). For the ICW data, PMLC20 concentrations were normalized using the cell dyes and with the WB data, PMLC20 values were normalized to GAPDH. The normalized data are expressed as a percentage of the vehicle (V) controls. A. Data from the ICW assay. Background wells (B) had no primary antibody or cell dyes. Cells were plated at a density of 600 cells/mm2 and treated with vehicle or increasing concentrations of OT (10−10 to 10−7 M). The time course varied from 20 sec (darkest histogram in each grouping) through 30, 45 and 60 sec or 2, 5 or 10 minutes (lightest histogram in each grouping). B. The treatment and time protocols were similar to figure 7A. The protein was extracted under mild (cold PBS/Lysis Buffer) conditions and the proteins measured using western blots as indicated. C. Experimental protocol similar to B except that the protein extraction was performed using the more stringent (TCA/Acetone/DTT) conditions.
Figure 8
Figure 8. Assessment using the ICW technique of pharmacological manipulation of PMLC20.
Uterine myocytes were seeded in microplate wells at 600 cells/mm2 and treated with OT (from 10−14 to 10−6 M) for 20 sec in the presence or absence of 15-minute pre-incubation with specific pharmacological agents (n = 7 separate cultures). The normalized data are expressed as a percentage of the vehicle controls. As expected, the cells demonstrated a brisk response to OT that was diminished in the presence of an inhibitor of MLCK (ML-7, 50 µM), CaM (W7, 50 µM), phosphatidyl inositol-PLC (Edelfosine, 20 µM), and L-type Ca2+ channels (Nifedipine, 20 µM). Relative PMLC20 levels (normalized to cell content) are expressed as a percentage of vehicle control. All of the pharmacological agents significantly (p<0.0001) attenuated the concentration-dependent PMLC20 increase induced by OT as determined by two-factor ANOVA.

Similar articles

Cited by

References

    1. Weldon S, Ambroz K, Schutz-Geschwender A, Olive DM. Near-infrared fluorescence detection permits accurate imaging of loading controls for Western blot analysis. Anal Biochem. 2008;375:156–158. - PubMed
    1. Wang YV, Wade M, Wong E, Li YC, Rodewald LW, et al. Quantitative analyses reveal the importance of regulated Hdmx degradation for p53 activation. Proc Natl Acad Sci U S A. 2007;104:12365–12370. - PMC - PubMed
    1. Jungblut P, Eckerskorn C, Lottspeich F, Klose J. Blotting efficiency investigated by using two-dimensional electrophoresis, hydrophobic membranes and proteins from different sources. Electrophoresis. 1990;11:581–588. - PubMed
    1. Tovey ER, Baldo BA. Comparison of semi-dry and conventional tank-buffer electrotransfer of proteins from polyacrylamide gels to nitrocellulose membranes. Electrophoresis. 1987;8:384–387.
    1. Selkirk JV, Nottebaum LM, Ford IC, Santos M, Malany S, et al. A novel cell-based assay for G-protein-coupled receptor-mediated cyclic adenosine monophosphate response element binding protein phosphorylation. J Biomol Screen. 2006;11:351–358. - PubMed

Publication types