. 2010 Jun 7;10(11):1391-400.
doi: 10.1039/b926849a. Epub 2010 Apr 8.

Multidimensional analysis of the frequencies and rates of cytokine secretion from single cells by quantitative microengraving

Affiliations

Multidimensional analysis of the frequencies and rates of cytokine secretion from single cells by quantitative microengraving

Qing Han et al. Lab Chip. .

Abstract

The large diversity of cells that comprise the human immune system requires methods that can resolve the individual contributions of specific subsets to an immunological response. Microengraving is process that uses a dense, elastomeric array of microwells to generate microarrays of proteins secreted from large numbers of individual live cells (approximately 10(4)-10(5) cells/assay). In this paper, we describe an approach based on this technology to quantify the rates of secretion from single immune cells. Numerical simulations of the microengraving process indicated an operating regime between 30 min-4 h that permits quantitative analysis of the rates of secretion. Through experimental validation, we demonstrate that microengraving can provide quantitative measurements of both the frequencies and the distribution in rates of secretion for up to four cytokines simultaneously released from individual viable primary immune cells. The experimental limits of detection ranged from 0.5 to 4 molecules/s for IL-6, IL-17, IFNgamma, IL-2, and TNFalpha. These multidimensional measures resolve the number and intensities of responses by cells exposed to stimuli with greater sensitivity than single-parameter assays for cytokine release. We show that cells from different donors exhibit distinct responses based on both the frequency and magnitude of cytokine secretion when stimulated under different activating conditions. Primary T cells with specific profiles of secretion can also be recovered after microengraving for subsequent expansion in vitro. These examples demonstrate the utility of quantitative, multidimensional profiles of single cells for analyzing the diversity and dynamics of immune responses in vitro and for identifying rare cells from clinical samples.


Figures
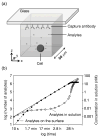
Figure 1
Figure 1
Analysis of mass transfer and distribution of analytes during microengraving. (a) Schematic of the configuration of one microwell containing a single cell during microengraving. (b) Plot of the calculated quantity of analytes accumulated in the media (○) and on the surface of the glass (●) during microengraving when the cell secretes at a constant rate of 10 molecules/s. The solid line indicates the cumulative quantity of analytes secreted by the cell over time. For this simulation, the affinity of the capture antibody was KD=100 pM, and the density of binding sites on the surface was θ0=10−9 mol/m2.
Figure 2
Figure 2
Single-analyte measurements using microengraving. (a) Measurement of IL-6 secreted by individual human PBMCs. Boxplot of relative MFI of captured IL-6 as a function of incubation time. n is the number of events in each box. The solid line was fit by linear regression of the median values. Statistics were determined by a two-tailed Student’s t-test. (b) Measurement of the secretion of antibodies from mouse hybridoma cells. The relative MFI of the signals were plotted as a function of the number of cells contained in each well for three different incubation times (15, 30, and 45 min). Solid lines were fit by linear regression. n is the number of events of each box.
Figure 3
Figure 3
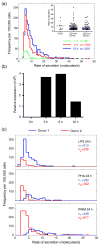
Quantification of the frequencies and rates of secretion for single cells producing IL-6. (a,b) Production of IL-6 by human PBMCs following stimulation with LPS for 3, 6, or 12 h. (a) Histograms of the distribution of rates of secretion of IL-6 measured by microengraving (2 h) as a function of the time allowed for stimulation (3 h, green; 6 h, red; 12 h, blue). Insert: A plot of the specific rates of secretion determined for different subsets of cells within the array after 6 h stimulation. Horizontal bars indicate the mean value for each group. (b) mRNA levels of IL-6 measured by quantitative PCR post-stimulation. (c) Histograms of the distribution of rates of secretion of IL-6 from PBMCs from two donors measured by microengraving (2 h) following stimulation with LPS, PHA or PWM for 24 h. The values n indicated in (a) and (c) are the normalized frequencies of responding cells for each condition.
Figure 4
Figure 4
Quadriplexed analysis of cytokines secreted from single cells. Human PBMCs were stimulated with PMA and ionomycin for 6 h, followed by microengraving for 2 h. (a) Representative images of individual cells in microwells matched with micrographs from the corresponding microarray of cytokines (arranged in rows). The first column shows composite micrographs of microwells (phase contrast) and viable cells (Calcein AM). The remaining four columns are micrographs extracted from the matching location on the printed microarray for each of four cytokines (IL-17, blue; IFNγ, green; IL-2, yellow; TNFα, red). Orange boxes outside the images indicate the positive spots in each row (MFI > background + 3SD). (b) Histograms of the calculated rates of secretion for each group of cytokine-producing cells. The colors are consistent with the assignments in (a). The inset rows of squares in each histogram indicate the combination of cytokines produced by the cells represented in the plot. The values of n indicated on each histogram are the normalized frequencies of cytokine-producing cells per 100,000 cells. The histograms were constructed with data from three independent experiments. (c) Histograms of the rates of secretion measured for CD4 and CD8 T cells producing IFNγ (top) or IL-2 (bottom). n is the number of cells imaged after microengraving bearing the indicated surface markers.
Figure 5
Figure 5
Recovery and expansion of T cell lines selected by their cytokine profiles. T cells were stimulated with LPS-activated monocytes and anti-CD3 for 3 days, and then their cytokine profiles were determined by microengraving (2 h). The cells were cultured in the microwells for 48 h after microengraving, and then recovered by micromanipulation. The selected cells were expanded on irradiated PBMCs for 2 weeks, and then characterized by flow cytometry and intracellular staining. Fluorescent micrographs (top panels) indicate the cytokine profile measured by microengraving for (a) IL-17 secreting cells and (b) IFNγ-secreting cells. The number of cells present in both wells at the time of retrieval was four. The scatter plots (bottom panels) show the results of intracellular cytokine staining detected by flow cytometry. The expanded cells were stimulated with PMA/ionomycin in the presence of monensin, then fixed, permeabilized, and stained with antibodies against IFNγ (labeled with phycoerythrin (PE)) and IL-17 (labeled with allophycocyanin (APC)). Cytometry data were plotted in the graph according to the fluorescence intensities measured from both channels.

References

    1. Pantaleo G, Harari A. Nat Rev Immunol. 2006;6:417–423. - PubMed
    1. Seder RA, Darrah PA, Roederer M. Nat Rev Immunol. 2008;8:247–258. - PubMed
    1. Streeck H, Frahm N, Walker B. Nature Protocols. 2009;4:461–469. - PubMed
    1. Gazagne A, Claret E, Wijdenes J, Yssel H, Bousquet F, Levy E, Vielh P, Scotte F, Goupil TL, Fridman WH, Tartour E. Journal of Immunological Methods. 2003;283:91–98. - PubMed
    1. Rebhahn JA, Bishop C, Divekar AA, Jiminez-Garcia K, Kobie JJ, Lee FEH, Maupin GM, Snyder-Cappione JE, Zaiss DM, Mosmann TR. Computer methods and programs in biomedicine. 2008;92:54–65. - PMC - PubMed

Publication types

MeSH terms