. 2010 May 25;4(5):2755-65.
doi: 10.1021/nn100213v.

Molecular mapping of tumor heterogeneity on clinical tissue specimens with multiplexed quantum dots

Affiliations

Molecular mapping of tumor heterogeneity on clinical tissue specimens with multiplexed quantum dots

Jian Liu et al. ACS Nano. .

Abstract

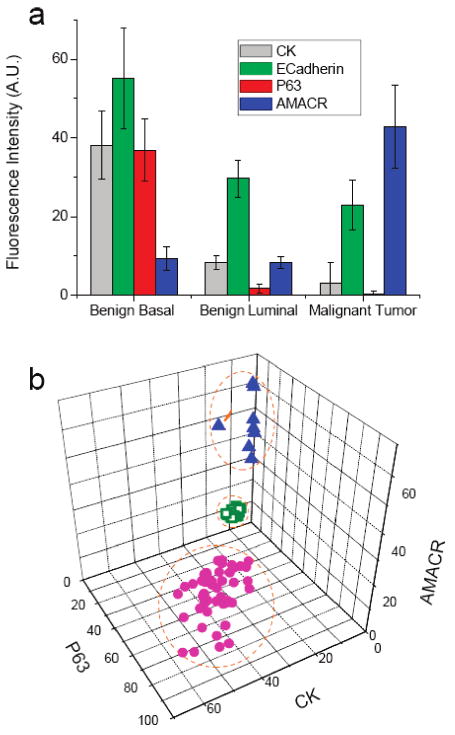
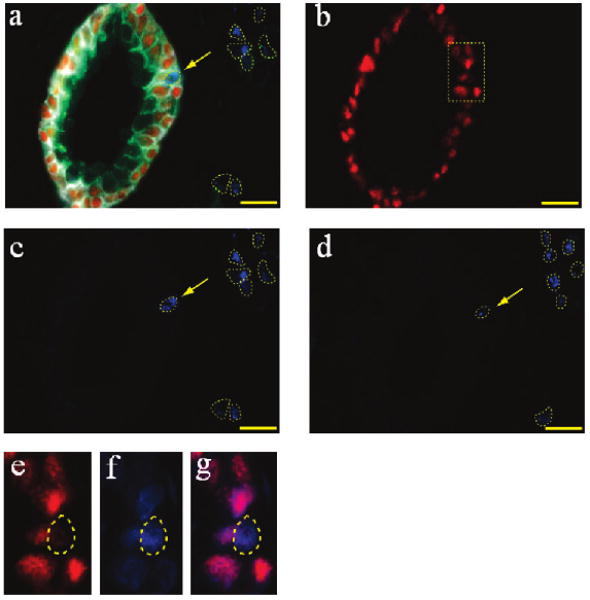
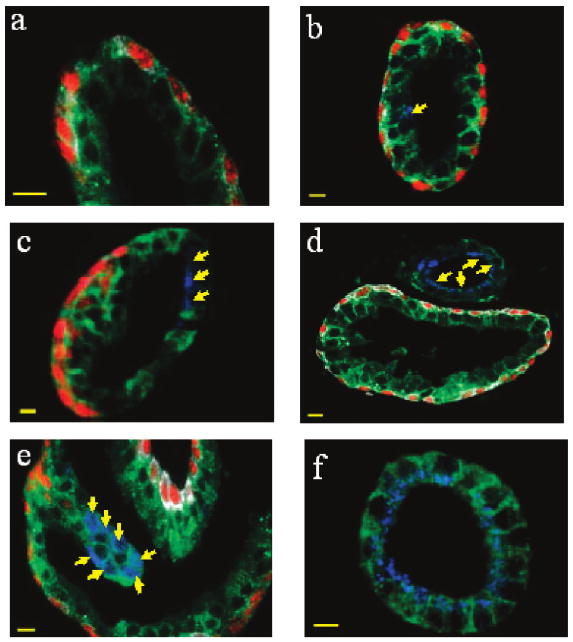
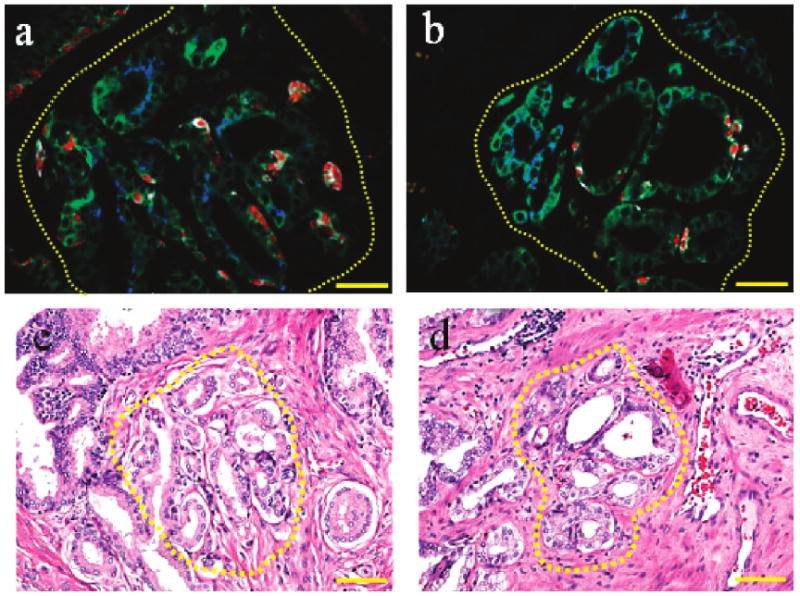
Tumor heterogeneity is one of the most important and challenging problems not only in studying the mechanisms of cancer development but also in developing therapeutics to eradicate cancer cells. Here we report the use of multiplexed quantum dots (QDs) and wavelength-resolved spectral imaging for molecular mapping of tumor heterogeneity on human prostate cancer tissue specimens. By using a panel of just four protein biomarkers (E-cadherin, high-molecular-weight cytokeratin, p63, and alpha-methylacyl CoA racemase), we show that structurally distinct prostate glands and single cancer cells can be detected and characterized within the complex microenvironments of radical prostatectomy and needle biopsy tissue specimens. The results reveal extensive tumor heterogeneity at the molecular, cellular, and architectural levels, allowing direct visualization of human prostate glands undergoing structural transitions from a double layer of basal and luminal cells to a single layer of malignant cells. For clinical diagnostic applications, multiplexed QD mapping provides correlated molecular and morphological information that is not available from traditional tissue staining and molecular profiling methods.


Figures

Figure 1
Figure 1
Schematic illustration of sequential QD staining in which two primary antibodies from two animal species are used to recognize two tissue antigens. A mixture of two primary antibodies from two species (e.g., rabbit and mouse) is first used to recognize two antigens (A and B) in the tissue section (first arrow, step 1). After washing, a mixture of two secondary antibody QD conjugates (e.g., goat anti-rabbit QD655 and goat anti-mouse QD605) is applied to stain the two primary antibodies (second arrow, step 2). The same procedure is repeated by using primary antibodies for two additional antigens (third arrow, step 3) followed by the use of two secondary antibody QD conjugates (e.g., goat anti-rabbit QD565 and goat anti-mouse QD705 or QD525) (fourth arrow, step 4).
Figure 2
Figure 2
Fluorescence images and quantitative biomarker analysis of single prostate cells extracted from human tissue specimens. The tissue sections were stained by using two primary antibodies and two secondary antibody QD conjugates in a sequential manner for two tissue antigens (p63 and cytokeratin HMW) with distinct cellular localization patterns. The nuclear biomarker p63 (red) was stained first, followed by QD staining of the membrane/cytoplasmic biomarker cytokeratin HMW (green). (a) Deconvolved images of single basal cells in a benign prostate gland showing the membrane/cytoplasmic distribution of cytokeratin HMW (top panel), the nuclear distribution of p63 (middle panel), and their composite images showing minimal spatial overlap (bottom panel). (b) Line plots of QD staining fluorescence intensities for cytokeratin HWM (green), p63 (red), and background (black); see the dashed lines in panel a. Scale bar = 2 μm.
Figure 3
Figure 3
(a) QD emission spectra and tissue autofluorescence data used for color coding and spectral deconvolution. (b) Raw and (c) processed fluorescence images of prostate tissue specimens after multiplexed QD immunostaining for four protein biomarkers. Note that spectral imaging allows color-encoded biomarkers to be extracted and highlighted in the deconvolved image. The protein biomarkers are E-cadherin (green), cytokeratin HMW (white), p63 (red), and AMACR (blue), as shown in encoded pseudocolors in image c.
Figure 4
Figure 4
Four biomarker multiplexed QD staining images (a,b) and single biomarker immunohistochemical staining images (c,d) of adjacent prostate cancer tissue sections. The patient was a 68 year old Caucasian male who underwent radical prostatectomy. The remarkable similarities in staining patterns and intensities indicate that the multiplexed QD staining images are highly consistent and reproducible and also are strongly correlated with IHC and H&E stained images (see Supporting Information Figure S1). The protein biomarkers in panels a and b are E-cadherin (green), CK HMW (white), p63 (red), and AMACR (blue). The single biomarker in panels c and d is E-cadherin. In image a, normal prostate glands are annotated with a star symbol; malignant glands with an arrow; glands showing features of prostatic intraepithelial neoplasia (PIN) are annotated with an asterisk. Objective = 20×. Scale bar = 100 μm.
Figure 5
Figure 5
Quantitative biomarker data for three major cell types “digitally” extracted from multiplexed QD staining images of human prostate cancer specimens. (a) Profiles of four biomarkers (CK HMW, E-cadherin, p63, and AMACR) for benign basal cells, benign luminal cells, and malignant tumor cells. (b) Scatter plots of three biomarkers (CK HMW, p63, and AMACR) showing that the major types of prostate cells can be separated with nearly 100% precision. Purple dots, benign basal cells; green dots, benign luminal cells; and blue dots, malignant tumor cells. The protein marker E-cadherin is not used in these plots because it is expressed in all three types of prostate cells.
Figure 6
Figure 6
Identification of single malignant tumor cells in a predominantly benign prostate gland by QD multiplexed staining of four protein biomarkers (E-cadherin, green; CK HMW, white; p63, red; and AMACR, blue). (a) Composite image showing the distinct staining patterns of a largely benign gland (central) and surrounding malignant cells (blue signals in dotted circles). A single malignant tumor cell in the basal gland layer is indicated with an arrow. (b) Deconvolved image showing the distribution of p63-positive benign basal cells. (c,d) Deconvolved images showing the distribution of AMACR-positive malignant tumor cells in two adjacent tissues. The staining similarities provide strong evidence that the malignant cells identified in panel a are indeed cancer and are not experimental artifacts. (e–g) Zoomed-in views of the boxed area in panel b showing that the single malignant cells identified by AMACR staining are negative in p63 staining, as expected for truly malignant cells. A cell is, in fact, present at that location, as shown by the DAPI nuclear staining (also in blue) (f), and by the composite p63 and DAPI image (g). Objective = 100×. Scale bar = 20 μm.
Figure 7
Figure 7
Multiplexed QD staining fluorescence images obtained from human prostatectomy specimens highlighting cellular and glandular heterogeneity. (a) Benign prostate gland, as judged by characteristic basal – luminal cell layers and the absence of AMACR staining. (b) Largely benign prostate gland with a single malignant or premalignant cell in the luminal layer, as judged by positive AMACR staining (see arrow). (c) Prostate gland with a malignant segment (yellow arrows) and a benign segment (intense red p63 staining), as well as intermediate structures (low AMACR and absent p63 staining). (d) Malignant gland (yellow arrows) sitting next to a benign gland (separated by only 5 – 10 μm). (e) Complex “folded” prostate gland in which one portion is malignant (yellow arrows) while the rest is largely benign. (f) Completely malignant gland, as judged by intense AMACR staining and absent basal cell CK and p63 signals. Scale bar = 10 μm.
Figure 8
Figure 8
Comparison of multiplexed QD mapping (a,b) and traditional H&E staining images (c,d) for two histopathologically complex foci on adjacent prostate cancer tissue sections. The dashed circles in images a and c correspond to one complex region, and the dashed circles in images b and d correspond to another complex region. In panels a and b, objective = 40×, scale bar = 50 μm. In panels c and d, objective = 20×; scale bar = 100 μm.

References

    1. Alivisatos AP. The Use of Nanocrystals in Biological Detection. Nat Biotechnol. 2004;22:47–52. - PubMed
    1. Michalet X, Pinaud FF, Bentolila LA, Tsay JM, Doose S, Li JJ, Sundaresan G, Wu AM, Gambhir SS, Weiss S. Quantum Dots for Live Cells, In Vivo Imaging, and Diagnostics. Science. 2005;307:538–544. - PMC - PubMed
    1. Gao XH, Yang L, Petras JA, Marshall FF, Simons JW, Nie SM. In Vivo Molecular and Cellular Imaging with Quantum Dots. Curr Opin Biotechnol. 2005;16:63–72. - PubMed
    1. Smith AM, Duan H, Mohs AM, Nie SM. Bioconjugated Quantum Dots for In Vivo Molecular and Cellular Imaging. Adv Drug Delivery Rev. 2008;60:1226–1240. - PMC - PubMed
    1. Xing Y, Chaudry Q, Shen C, Kong KY, Zhau HE, Chung LW, Petros JA, O'Regan RM, Yezhelyev MV, Simons JW, et al. Bioconjugated Quantum Dots for Multiplexed and Quantitative Immunohistochemistry. Nat Protoc. 2007;2:1152–1165. - PubMed

Publication types