

Marginal models for clustered time-to-event data with competing risks using pseudovalues
- PMID: 20377579
- PMCID: PMC2902638
- DOI: 10.1111/j.1541-0420.2010.01416.x
Marginal models for clustered time-to-event data with competing risks using pseudovalues
Abstract
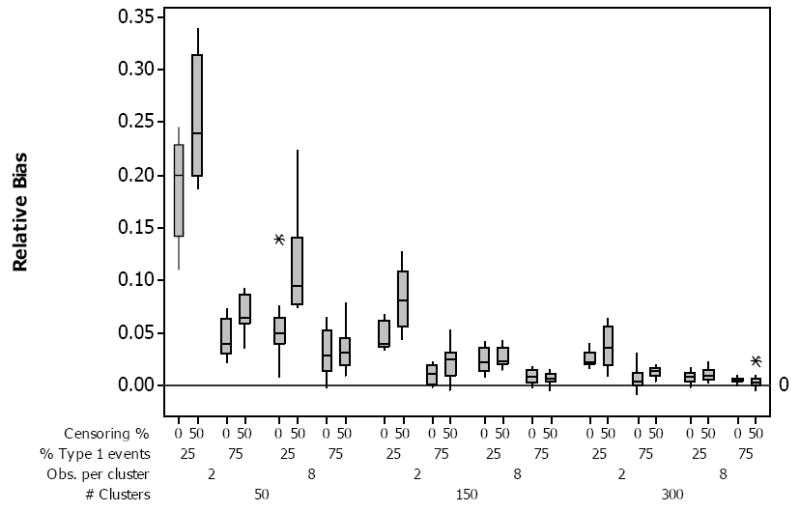
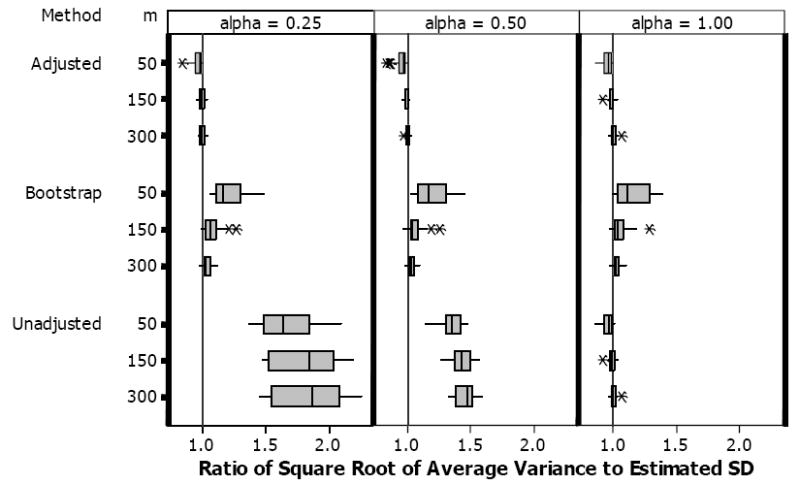
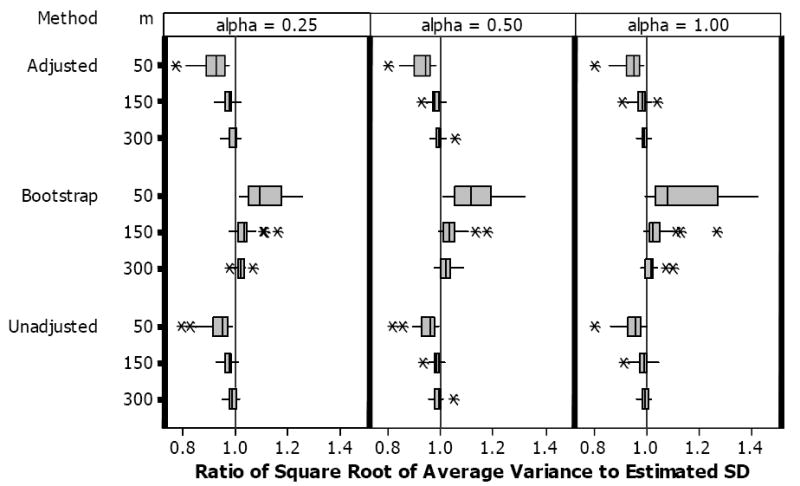
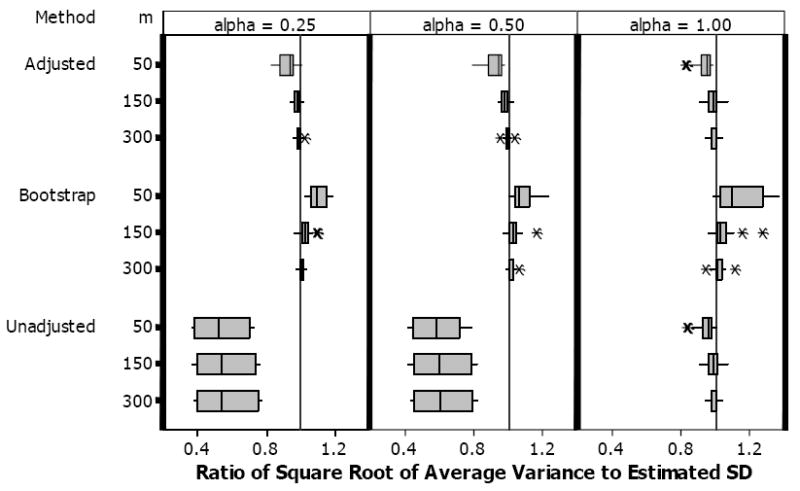
Many time-to-event studies are complicated by the presence of competing risks and by nesting of individuals within a cluster, such as patients in the same center in a multicenter study. Several methods have been proposed for modeling the cumulative incidence function with independent observations. However, when subjects are clustered, one needs to account for the presence of a cluster effect either through frailty modeling of the hazard or subdistribution hazard, or by adjusting for the within-cluster correlation in a marginal model. We propose a method for modeling the marginal cumulative incidence function directly. We compute leave-one-out pseudo-observations from the cumulative incidence function at several time points. These are used in a generalized estimating equation to model the marginal cumulative incidence curve, and obtain consistent estimates of the model parameters. A sandwich variance estimator is derived to adjust for the within-cluster correlation. The method is easy to implement using standard software once the pseudovalues are obtained, and is a generalization of several existing models. Simulation studies show that the method works well to adjust the SE for the within-cluster correlation. We illustrate the method on a dataset looking at outcomes after bone marrow transplantation.
© 2010, The International Biometric Society.
Figures
Similar articles
-
A positive stable frailty model for clustered failure time data with covariate-dependent frailty.Biometrics. 2011 Mar;67(1):8-17. doi: 10.1111/j.1541-0420.2010.01444.x. Biometrics. 2011. PMID: 20528861 Free PMC article.
-
Regression modeling of competing risks data based on pseudovalues of the cumulative incidence function.Biometrics. 2005 Mar;61(1):223-9. doi: 10.1111/j.0006-341X.2005.031209.x. Biometrics. 2005. PMID: 15737097
-
Competing risks regression for clustered data.Biostatistics. 2012 Jul;13(3):371-83. doi: 10.1093/biostatistics/kxr032. Epub 2011 Oct 31. Biostatistics. 2012. PMID: 22045910 Free PMC article.
-
Pseudo-observations in survival analysis.Stat Methods Med Res. 2010 Feb;19(1):71-99. doi: 10.1177/0962280209105020. Epub 2009 Aug 4. Stat Methods Med Res. 2010. PMID: 19654170 Review.
-
Folic acid supplementation and malaria susceptibility and severity among people taking antifolate antimalarial drugs in endemic areas.Cochrane Database Syst Rev. 2022 Feb 1;2(2022):CD014217. doi: 10.1002/14651858.CD014217. Cochrane Database Syst Rev. 2022. PMID: 36321557 Free PMC article.
Cited by
-
A flexible semiparametric modeling approach for doubly censored data with an application to prostate cancer.Stat Methods Med Res. 2016 Aug;25(4):1718-35. doi: 10.1177/0962280213498325. Epub 2013 Jul 30. Stat Methods Med Res. 2016. PMID: 23907782 Free PMC article.
-
Testing for center effects on survival and competing risks outcomes using pseudo-value regression.Lifetime Data Anal. 2019 Apr;25(2):206-228. doi: 10.1007/s10985-018-9443-6. Epub 2018 Jul 5. Lifetime Data Anal. 2019. PMID: 29978275 Free PMC article.
-
Adjusted curves for clustered survival and competing risks data.Commun Stat Simul Comput. 2025;54(1):120-143. doi: 10.1080/03610918.2023.2245583. Epub 2023 Aug 16. Commun Stat Simul Comput. 2025. PMID: 39790711
-
ROBUST MIXED EFFECTS MODEL FOR CLUSTERED FAILURE TIME DATA: APPLICATION TO HUNTINGTON'S DISEASE EVENT MEASURES.Ann Appl Stat. 2017;11(2):1085-1116. doi: 10.1214/17-AOAS1038. Epub 2017 Jul 20. Ann Appl Stat. 2017. PMID: 29399240 Free PMC article.
-
A comparison of statistical methods to predict the residual lifetime risk.Eur J Epidemiol. 2022 Feb;37(2):173-194. doi: 10.1007/s10654-021-00815-8. Epub 2022 Jan 3. Eur J Epidemiol. 2022. PMID: 34978669 Free PMC article. Review.
References
-
- Andersen PK, Klein JP, Rosthoj S. Generalized linear models for correlated pseudo-observations with applications to multi-state models. Biometrika. 2003;90:15–27.
-
- Commenges D, Andersen PK. Score test of homogeneity for survival data. Lifetime Data Analysis. 1995;1:145–156. - PubMed
-
- Fine JP, Gray RJ. A proportional hazards model for the subdistribution of a competing risk. JASA. 1999;94:496–509.
-
- Graw F, Gerds TA, Schumacher M. On pseudo-values for regression analysis in competing risks models. Lifetime Data Analysis. 2009;15:241–255. - PubMed
Publication types
MeSH terms
Grants and funding
LinkOut - more resources
Full Text Sources
Medical
