. 2010 Mar;31(6):978-93.
doi: 10.1111/j.1460-9568.2010.07133.x. Epub 2010 Mar 3.

Biochemical and functional properties of distinct nicotinic acetylcholine receptors in the superior cervical ganglion of mice with targeted deletions of nAChR subunit genes

Affiliations

Biochemical and functional properties of distinct nicotinic acetylcholine receptors in the superior cervical ganglion of mice with targeted deletions of nAChR subunit genes

Reinhard David et al. Eur J Neurosci. 2010 Mar.

Abstract

Nicotinic acetylcholine receptors (nAChRs) mediate fast synaptic transmission in ganglia of the autonomic nervous system. Here, we determined the subunit composition of hetero-pentameric nAChRs in the mouse superior cervical ganglion (SCG), the function of distinct receptors (obtained by deletions of nAChR subunit genes) and mechanisms at the level of nAChRs that might compensate for the loss of subunits. As shown by immunoprecipitation and Western blots, wild-type (WT) mice expressed: alpha 3 beta 4 (55%), alpha 3 beta 4 alpha 5 (24%) and alpha 3 beta 4 beta 2 (21%) nAChRs. nAChRs in beta 4 knockout (KO) mice were reduced to < 15% of controls and no longer contained the alpha 5 subunit. Compound action potentials, recorded from the postganglionic (internal carotid) nerve and induced by preganglionic nerve stimulation, did not differ between alpha 5 beta 4 KO and WT mice, suggesting that the reduced number of receptors in the KO mice did not impair transganglionic transmission. Deletions of alpha 5 or beta2 did not affect the overall number of receptors and we found no evidence that the two subunits substitute for each other. In addition, dual KOs allowed us to study the functional properties of distinct alpha 3 beta4 and alpha 3 beta 2 receptors that have previously only been investigated in heterologous expression systems. The two receptors strikingly differed in the decay of macroscopic currents, the efficacy of cytisine, and their responses to the alpha-conotoxins AuIB and MII. Our data, based on biochemical and functional experiments and several mouse KO models, clarify and significantly extend previous observations on the function of nAChRs in heterologous systems and the SCG.


Figures
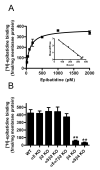
Figure 1
Figure 1. [3H]-epibatidine binding sites are significantly reduced in α5β4-double and β4-single KO mice
A. Kinetics of [3H]-epibatidine binding to membrane homogenates from wild type mouse SCG. Data points are means of specific binding ± SEM of duplicate measurements. Nonspecific binding determined by the presence of 300 μM nicotine was subtracted from overall to obtain specific binding. Parameters of the curve fitted to the data points were 112.6 ± 9.1 pM (KD) and 371.2 ± 13.5 fmol/mg protein (Bmax). Inset: Scatchard plot of data (abscissa: bound [3H]-epibatidine (fmol/mg); ordinate: bound/free [3H]-epibatidine (fmol/mg protein)/pM)). Averaged kinetic parameters ± SEM from 4 such experiments were 150.7 ± 25.6 pM (KD) and 345.8 ± 25.6 fmol/mg protein (Bmax). B. Specific binding of 1 nM [3H]-epibatidine to SCG membrane homogenates taken from wild type mice and from mice with distinct deletions of indicated nAChR subunit genes. Data are means ± SEM of 3-10 independent experiments, each performed with triplicate measurements. Compared to WT SCG, [3H]-epibatidine binding was significantly reduced only in α5β4-double and β4-single KO animals (one-way ANOVA, F = 35,46, P < 0.0001, followed by Dunnett’s post-hoc test, **P < 0.01). [3H]-epibatidine binding sites did not differ significantly between α5β4-double (7.8 % of WT) and β4-single KO animals (13.2 % of WT, Student’s t-test).
Figure 2
Figure 2. Subunit composition of nAChRs in the wild-type mouse SCG, and absence of compensation in the SCG of mice with deletions of a single nAChR subunit gene
nAChRs from SCG membranes of wild-type mice (Panel A) or mice with deletions of the α5 (Panel B), the β2 (Panel C), or the β4 subunits (Panel D) were solubilized, labeled with 1 nM [3H]-epibatidine and immunoprecipitated with each of the subunit-specific antibodies indicated at the abscissa. Nonspecific binding was measured in the presence of 300 μM nicotine and subtracted from overall to obtain the specific binding shown in the figure. Data are means ± SEM of 4-8 independent experiments, each performed with triplicate (panels A, B and C) or duplicate (panel D) measurements. Note in Panels A and B that anti-α3 and anti-β4 antibodies precipitate an identical number of receptors, and that the combined use of anti-β4 and anti-β2 antibodies does not precipitate more receptors than the single use of anti-β4 antibodies. The levels of α4 are not significantly different from zero (P = 0.052 in Panel A and P = 0.189 in Panel B, one sample Students t-test). Anti-α5 and anti-β2 antibodies precipitated 24 % and 21 %, respectively, of the receptors that were precipitated by the combined use of anti-β4 and anti-β2 measurements. n.s: not significantly different from zero (P > 0.05, one sample Students t-test). n.d.: not determined.
Figure 3
Figure 3. Subunit composition of nAChRs in the mouse SCG
A. The α5 subunit co-assembles with β4 only and is not up-regulated in the SCG of β2 KO mice. nAChRs from SCG membranes of WT, β2, and β4 KO mice (indicated at the abscissa) were solubilized, labeled with 1 nM [3H]-epibatidine, and immunoprecipitated with our anti-α5 antibody. Data are the mean specific binding ± SEM of 3-8 independent experiments, each performed with triplicate measurements. Note that levels of the α5 subunit do not significantly differ between WT and β2 KO animals. In contrast, α5 is lost in the SCG of β4 KO mice (not significantly different from zero, P > 0.05, one sample Students t-test). All columns were compared using one-way ANOVA, F = 10.38, P = 0.0008, followed by a Dunnett’s post-hoc multiple comparison test: WT vs β2 KO: P > 0.05; WT vs β4 KO: P < 0.01) B. The β2 subunit does not compensate for the absence of either α5 or β4. nAChRs solubilized and labeled as described above were immunoprecipitated with our anti-β2 antibody. Data are the mean specific binding ± SEM of 4-6 independent experiments, each performed with triplicate measurements. Note that β2 levels do not differ significantly between the 3 genotypes indicated at the abscissa (one-way ANOVA, F = 0.227, P = 0.800). C. The subunits α5 and β2 do not co-assemble in the same receptor. nAChRs solubilized and labeled as described above were immunoprecipitated in parallel with anti-α5 (white bars), anti-β2 (black bars), or a combination of both antibodies (grey bar). Data are the mean specific binding ± SEM of 5 independent experiments, each performed with triplicate measurements. The number of receptors immunoprecipitated by each of the single antibodies differed significantly from the number of receptors precipitated by a combination of the two antibodies (P < 0.01). The arithmetic sum of the two individual precipitations is not significantly different from the result obtained by combined immunoprecipitation with both antibodies (repeated measures one-way ANOVA F = 14.72, P = 0.0003, followed by a Dunnett’s multiple comparison test with data referenced to the result obtained by the combined immunoprecipitation with both antibodies). D. The α5 subunit does not co-assemble with β2. The left part of the figure illustrates the specificity of our anti-β2 antibody for Western blot analyses. Note bands of approximately 52 kD in brain and SCG samples from WT and β4 KO animals, and the absence of such bands in β2 KO mice. As shown on the right part of the figure, the band can also be detected in Western blots of receptors immunoprecipitated with anti-α3, but not with anti-α5 antibodies. The cerebellum is added as a further positive control. E. The α5 subunit co-assembles with β4. The left part of the figure shows the specificity of our anti-β4 antibody for Western blot analyses. Note major band of approximately 56 kD in SCG samples from WT and β2 KO mice and the absence of such a band in β4 KO animals. The anti-β4 antibody detects a solid band in Western blots of receptors immunoprecipitated with anti-α3, and a much weaker band if receptors were immunoprecipitated with anti-α5 antibodies (right part of the figure).
Figure 4
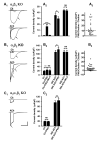
Figure 4. Probing α7 nAChRs
A. Patch clamp measurements of SCG neurons from α5β4 KO animals. A1, upper panel: Unveiling of α7-mediated currents by the type II positive allosteric modulator PNU-120596, and rapid reversal of the effect by methyllycaconitine (MLA). The figure shows a particularly large effect of PNU-120596. 3 superimposed current traces in response to 10 mM choline (Ch, indicated by bar); 10 mM choline in the presence of - and following a 10 sec superfusion with - 10 μM PNU-120596 (arrow); pretreatment with 5 nM MLA for 2 min, followed by 10 mM choline plus 10 μM PNU-120596 (arrowhead). Note that choline by itself has a negligible effect. Calibration: 4 sec, 1 nA. A1, lower panel: Same cell, with currents induced by 300 μM ACh (in the presence of 0.1 μM atropine, bar). 10 μM PNU-120596 (arrow) has no effect on initial peak current but gives rise to a large second peak of delayed onset (arrow). Arrowhead denotes current following pretreatment with MLA. Calibration: 4 sec, 1 nA A2. See panel B2 for a labeling of bars. Choline-induced currents in the presence of 10 μM PNU-120596 (Ch+PNU) are significantly larger than in the absence of PNU (Ch) or after a 2 min pretreatment with 5 nM MLA (Ch+PNU+MLA). Paired observations of 18 neurons (P = 0.0002, Wilcoxon test). Peak currents in response to 300 μM ACh are somewhat reduced (P = 0.0315, paired Student’s t-test, n = 13 neurons) in the presence of 10 μM PNU-120596 (300 ACh+PNU). Peak currents in response to 500 μM ACh are unaffected by a 2 min pretreatment with 5 nM MLA (500 ACh+MLA) (n = 22 neurons, P = 0.6041, paired Student’s t-test). A3. Net effect of 10 μM PNU-120596 obtained by subtracting the peak current in response to 10 mM choline from choline-induced current in the presence of PNU-120596. Dashed line indicates a Median value of 9.90 pA/pF (n = 24 cells). B. Patch clamp measurements of SCG neurons from α5β2 KO animals. B1, upper panel: Unveiling of α7-mediated currents by PNU-120596, and rapid reversal of the effect by MLA. The figure shows a particularly large effect of PNU-120596. 3 superimposed current traces in response to 10 mM choline (Ch, indicated by bar); 10 mM choline in the presence of - and following a 10 sec superfusion with - 10 μM PNU-120596 (arrow); pretreatment with 5 nM MLA for 2 min, followed by 10 mM choline plus 10 μM PNU-120596 (arrowhead). Note that choline by itself has a noticeable effect by activating α3β4 nAChRs. Calibration: 4 sec, 2 nA. B1, lower panel: Same cell, with currents induced by 300 μM ACh (in the presence of 0.1 μM atropine, bar). 10 μM PNU-120596 (arrows) has no effect on initial peak current but slows the decay of the current and the washout. Arrowhead denotes current following pretreatment with MLA. Calibration: 4 sec, 2 nA. B2. Choline-induced currents in the presence of 10 μM PNU-120596 (Ch+PNU) are significantly larger than in the absence of PNU (Ch). Paired observations of 16 neurons (P = 0.0015, Wilcoxon test). The inhibition of currents in response to choline plus PNU-120596 (Ch+PNU) by a 2 min pretreatment with 5 nM MLA (Ch+PNU+MLA) is statistically not significant (P = 0.4156, Wilcoxon test, n = 16). Peak currents in response to 300 μM ACh are somewhat enhanced in the presence of 10 μM PNU-120596 (300 ACh+PNU). N = 14 neurons (P = 0.0163, paired Student’s t-test). Peak currents in response to 500 μM ACh are unaffected by a 2 min pretreatment with 5 nM MLA (500 ACh+MLA). N = 25 neurons (P = 0.9692, paired Student’s t-test). B3. Net effect of 10 μM PNU-120596 obtained by subtracting the peak current in response to 10 mM choline from choline-induced current in the presence of PNU-120596. Dashed line indicates a Median value of 4.29 pA/pF (n = 33 cells). These data differ significantly from the data shown in panel A3 (P = 0.0023, Mann-Whitney test). C. Patch clamp measurements of SCG neurons from α5α7β2 KO animals. C1, upper panel: Currents in response to 10 mM choline (bar) are unaffected by 10 μM PNU-120596. Graph shows two superimposed current traces. The schedule of substance application is identical to panels A1 and B1. Calibration: 4 sec, 2 nA. C1, lower panel: Same cell, with currents induced by 300 μM ACh (in the presence of 0.1 μM atropine, bar). 10 μM PNU-120596 (arrow) has no effect on the time course of receptor desensitization and the washout of ACh. Calibration: 4 sec, 2 nA. C2. Choline-induced currents in the presence of 10 μM PNU-120596 (Ch+PNU) are not significantly different from currents in the absence of PNU (Ch). Paired observations of 35 neurons (P = 0.1918, Wilcoxon test). Peak currents in response to 300 μM ACh are somewhat enhanced in the presence of 10 μM PNU-120596 (300 ACh+PNU). N = 26 neurons (P = 0.0026, paired Student’s t-test).
Figure 5
Figure 5. Functional properties of α3β2 nAChRs (analyzed in α5β4 KO mice)
A1-3. Agonist-induced currents (upper panels; applications indicated by dotted lines), and corresponding concentration-response curves (lower panels) by the nAChR agonists ACh (A1, in the presence of 0.1 μM atropine), nicotine (A2), and 1,1-dimethyl-4-phenylpiperazinium iodide (DMPP) (A3). In order to construct the dose-response curves, peak current amplitudes were fitted to the logistic equation shown in Methods. Averaged fit parameters are provided in Table 1. Calibration A1-A3: 500 msec; 0.5 nA. B. Low efficacy of cytisine at α3β2 receptors: Maxima taken from full DMPP dose response curves were set in relation to responses by saturating concentrations of cytisine in the same cell. Cytisine at saturating concentrations produced only 10.76 ± 1.59 % of the effect of DMPP (n = 8). C. α3β2 nAChR up-regulation by nicotine: Peak currents in response to 300 μM ACh (in the presence of 0.1 μM atropine) in untreated cultures (Naïve; circles; n = 38), and in cultures treated for > 48 h with 100 μM nicotine (Nicotine; triangles; n = 67). Lines indicate the Median values 19.3 and 23.2 pA/pF, for naïve and nicotine-treated cultures, respectively; significantly different at P = 0.0087, Mann-Whitney test. D: Rapid desensitization of α3β2 nAChR. Patch clamp recording of a SCG neuron taken from a α5β4 KO mouse, with current induced by 300 μM ACh (in the presence of 0.1 μM atropine, dotted line). Dashed line indicates decay of current fitted to the sum of two exponential functions (displaced for clarity from original trace by 200 pA). Fit parameters are 115 msec (Tf, fast), 1477 msec (Ts, slow), −1171 pA (Af, fast), −472 pA (As, slow), −140 pA (plateau). Calibration: 2 sec, 1 nA. Averaged fit parameters from identically designed experiments are provided in Table 2.
Figure 6
Figure 6. Functional properties of α3β4 nAChRs (in α5β2 KO mice)
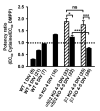
A. Agonist-induced currents (upper panels; applications indicated by dotted lines), and corresponding concentration-response curves (lower panels) by the nAChR agonists ACh (A1, in the presence of 0.1 μM atropine), nicotine (A2), DMPP (A3), and cytisine (A4). Arrows in A2 indicate an initial “hump” discussed in the Results section. In order to construct the dose-response curves, peak current amplitudes were fitted to the logistic equation shown in Methods. Averaged fit parameters are provided in Table 1. Calibration A1-A4: 500 msec; 2 nA. B. Potency ratios determined from agonist-induced peak currents elicited at the low end of the concentration-response curves. B1. α5β2 KO: Peak current amplitudes in response to 3 and 10 μM DMPP (circles) and cytisine (triangles), respectively, were fitted to the logistic equation with the constraints of a common slope and a maximum set to 7 nA. This resulted in fictitious EC50 values of 16.1 μM (DMPP) and 21.7 μM (cytisine) and a potency ration of 21.7/16.1 = 1.34. B2. β2 KO: Same protocol as described for panel B1. Fictitious EC50 values were 39.2 μM (DMPP) and 26.2 μM (cytisine), with a resulting potency ration of 0.67. Note that cytisine is more potent than DMPP in the β2 KO, whereas potencies are reversed in the α5β2 double KO. Averaged potency ratios from identically designed experiments are provided in Fig. 7. C. Patch clamp recording of a SCG neuron taken from a β2 KO mouse, with current induced by 300 μM ACh in the presence of 0.1 μM atropine (dotted line). Dashed line indicates decay of current fitted to the sum of two exponential functions (displaced for clarity from original trace by 200 pA). Fit parameters are 0.47 sec (Tf, fast), 6.98 sec (Ts, slow), −809 pA (Af, fast), −2899 pA (As, slow), −943 pA (plateau). Calibration: 2 sec, 1 nA. Averaged fit parameters from identically designed experiments are provided in Table 2.
Figure 7
Figure 7. Genotypes differ by their cytisine to DMPP potency ratios
Filled bars show mean ± SEM low-concentration potency ratios; hatch bars are mean ± SEM potency ratios deduced from full concentration-response curves of genotypes indicated at the abscissa. Potency ratios of cytisine by DMPP were calculated for individual cells by dividing the corresponding fictitious EC50 values (low concentration, see Fig. 6B for an example) or fully explored EC50 values (full concentration-response). Figures in parenthesis are the number of cells. The data for WT and α5 KO are from Fischer et al. (2005). Ratios > 1 (above the dotted line) indicate a higher potency of DMPP. One-way ANOVA (F = 28.47, P < 0.0001), followed by Newman-Keuls multiple comparison test. n.s. not significantly different (P > 0.05); * significantly different (P < 0.05); *** significantly different (P < 0.001).
Figure 8
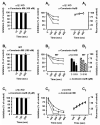
Figure 8. Effects of the α-conotoxins AuIB and MII
Currents were induced by 300 μM ACh (in the presence of 0.1 μM atropine, 0.5 μM TTX, and 0.1 mg/ml bovine serum albumin) in cultured SCG neurons of α5β2 KO (A1-A3, B3), WT (B1-B3), or α5β4 KO (C1-C3) mice, and in the absence (control, 100 %) or presence of the α-conotoxins AuIB or MII. A1. α5β2 KO mice: Bars (mean percentage of currents relative to controls ± SEM, n = 7-9 cells) show the absence of effects of α-conotoxin MII on nAChRs in SCG neurons of α5β2 KO mice. The application of 100 nM α-conotoxin MII for indicated periods of time does not significantly decrease peak currents (one sample Student’s t-test with reference to a hypothetical 100 %: P10 sec = 0.6752; P130 sec = 0.2009; P250 sec = 0.3046). A2. Time- and concentration-dependent inhibition by α-conotoxin AuIB of nAChRs remaining in SCG neurons of α5β2 KO mice. Triangles down: 3 μM (n = 5 cells); triangles up: 5 μM (n = 8 cells); circles: 10 μM α-conotoxin AuIB (n = 7 cells). Data points are the mean percentages of currents relative to controls ± SEM (shown if error bars exceed symbols). A3. Fast and full recovery of the inhibition by 5 μM (triangles down, n = 3 cells) and 10 μM α-conotoxin AuIB (circles, n = 4 cells). B1. WT mice: Bars (mean percentage of currents relative to controls ± SEM, n = 13 cells) show little effect of α-conotoxin MII on nAChRs in SCG neurons of WT mice. The application of 100 nM α- conotoxin MII for indicated periods of time leaves 100.4 % (after 10 sec, P = 0.6119), 98.4 % (after 130 sec, P = 0.0534), and 98.2 % (after 250 sec, P = 0.0498) of control peak currents (one sample Student’s t-test with reference to a hypothetical 100 %). B2. Time- and concentration-dependent inhibition by α-conotoxin AuIB of nAChRs in SCG neurons of WT mice. Triangles down: 3 μM (n = 8-11 cells); triangles up: 5 μM (n = 13-14 cells); circles: 10 μM α-conotoxin AuIB (n = 8 cells). Data points are the mean percentages of currents relative to controls ± SEM (shown if error bars exceed symbols). B3. Concentration-dependent inhibition by indicated concentrations of conotoxin AuIB of nAChR currents in SCG neurons of α5β2 KO (filled bars) or WT (hatched bars) mice. Currents induced by 300 μM ACh were measured 250 sec after toxin application and set in relation to control peak currents. AuIB has a significantly larger effect in α5β2 KO than in WT mice (AuIB at 5 μM: α5β2 KO: 55.2 ± 2.9 %, n = 8 cells; WT: 63 ± 2.4 %, n = 14 cells; P = 0.0483, Student’s t-test; AuIB at 10 μM: α5β2 KO: 34.0 ± 2.5 %, n = 7 cells; WT: 43.0 ± 3.0 %, n = 8 cells; P = 0.0414, Student’s t-test). C1. α5β4 KO mice: Bars (mean percentage of currents relative to controls ± SEM, n = 8 cells) show the absence of effects of α-conotoxin AuIB on nAChRs in SCG neurons of α5β4 KO mice. The application of 5 μM α-conotoxin AuIB for indicated periods of time does not significantly inhibit peak currents (one sample Student’s t-test with reference to a hypothetical 100 %: P10 sec = 0.1173; P130 sec = 0.5057; P250 sec = 0.0935). C2. Time- and concentration-dependent inhibition by α-conotoxin MII of nAChRs remaining in SCG neurons of α5β4 KO mice. Triangles down: 10 nM (n = 8 cells); triangles up: 30 nM (n = 11 cells); circles: 100 nM α-conotoxin MII (n = 6 cells). Data points are the mean percentages of currents relative to controls ± SEM (shown if error bars exceed symbols). Note that a 130 sec exposure to 100 nM α-conotoxin MII blocks 95 % of the currents. C3: Slow and partial recovery of the inhibition by 30 nM (triangles up, n = 9 cells) and 100 nM α-conotoxin MII (circles, n = 6 cells).
Figure 9
Figure 9. Compound action potentials do not differ between genotypes
A. Postganglionic compound action potentials (20 superimposed traces) recorded from the postganglionic (internal carotid) nerve in response to suprathreshold stimuli at 0.5 Hz to the preganglionic (SCG) nerve. Arrow shows the compound action potential, arrowhead the preganglionic potential, and asterix the stimulation artifact. The ganglion was taken from a 5 weeks old WT animal. Calibration: 20 msec, 200 μV. B: Bars show mean ± SEM compound action potential amplitudes measured in SCGs taken from 4-6 weeks old WT (n = 20), α5β2 KO (n = 14), and α5β4 KO (n = 16) mice. Note that mean amplitudes of either α5β2 KO or α5β4 do not differ significantly from WT (P > 0.05, one-way ANOVA (F = 0.8223, P = 0.4457), followed by a Dunnett’s multiple comparison test with data referenced to WT).

Similar articles

Cited by

References

    1. Albuquerque EX, Pereira EFR, Alkondon M, Rogers SW. Mammalian nicotinic acetylcholine receptors: From structure to function. Physiol. Rev. 2009;89:73–120. - PMC - PubMed
    1. Alkadhi KA, Alzoubi KH, Aleisa AM. Plasticity of synaptic transmission in autonomic ganglia. Prog. Neurobiol. 2005a;75:83–108. - PubMed
    1. Alkadhi KA, Alzoubi KH, Aleisa AM, Tanner FL, Nimer AS. Psychosocial stress-induced hypertension results from in vivo expression of long-term potentiation in rat sympathetic ganglia. Neurobiol. Dis. 2005b;20:849–857. - PubMed
    1. Brejc K, van Dijk WJ, Schuurmans M, van der Oost J, Smit AG, Sixma TK. Crystal structure of an ACh-binding protein reveals the ligand-binding domain of nicotinic receptors. Nature. 2001;411:269–276. - PubMed
    1. Cartier GE, Yoshikami D, Gray WR, Luo S, Olivera BM, McIntosh JM. A new α-conotoxin which targets α3β2 nicotinic acetylcholine receptors. J. Biol. Chem. 1996;271:7522–7528. - PubMed

Publication types

MeSH terms