. 2010 Mar;88(1):4-29.
doi: 10.1111/j.1468-0009.2010.00587.x.

Implicit value judgments in the measurement of health inequalities

Affiliations

Implicit value judgments in the measurement of health inequalities

Sam Harper et al. Milbank Q. 2010 Mar.

Abstract

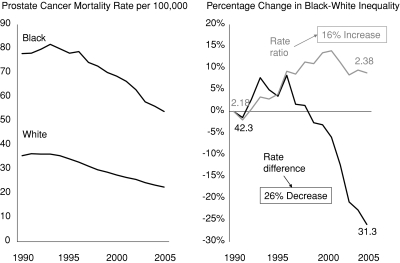
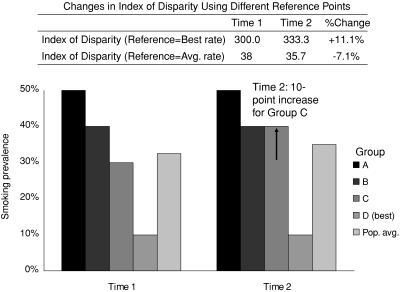
Context: Quantitative estimates of the magnitude, direction, and rate of change of health inequalities play a crucial role in creating and assessing policies aimed at eliminating the disproportionate burden of disease in disadvantaged populations. It is generally assumed that the measurement of health inequalities is a value-neutral process, providing objective data that are then interpreted using normative judgments about whether a particular distribution of health is just, fair, or socially acceptable.

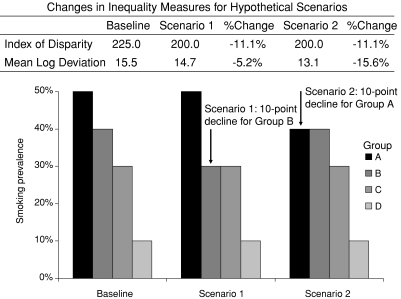
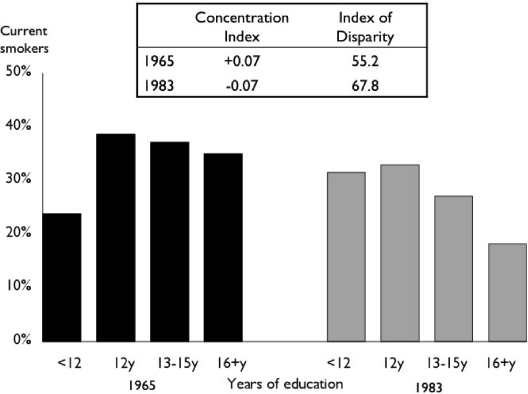
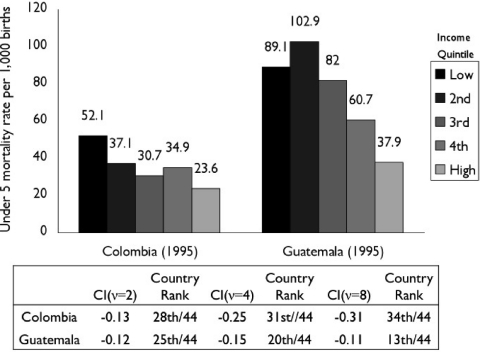
Methods: We discuss five examples in which normative judgments play a role in the measurement process itself, through either the selection of one measurement strategy to the exclusion of others or the selection of the type, significance, or weight assigned to the variables being measured.

Findings: Overall, we find that many commonly used measures of inequality are value laden and that the normative judgments implicit in these measures have important consequences for interpreting and responding to health inequalities.

Conclusions: Because values implicit in the generation of health inequality measures may lead to radically different interpretations of the same underlying data, we urge researchers to explicitly consider and transparently discuss the normative judgments underlying their measures. We also urge policymakers and other consumers of health inequalities data to pay close attention to the measures on which they base their assessments of current and future health policies.


Figures

Figure 1
Figure 1
Trends in Prostate Cancer among Black and White Males, and Percentage Change in the Black-White Rate Ratio and Rate Difference, 1990–2005. Note: The rate ratio is calculated as the black mortality rate divided by the white mortality rate. The rate difference is calculated as the black mortality rate minus the white mortality rate. Source: Authors’ calculations using SEER*Stat Software (National Cancer Institute Surveillance Research Program 2009), with underlying data provided by the National Center for Health Statistics 2009a, .
Figure 2
Figure 2
Changes in Inequality in Smoking Prevalence according to the Index of Disparity and Mean Log Deviation for Two Hypothetical Changes in the Distribution of Smoking across Social Groups. Note: The Index of Disparity is calculated as the average deviation of each group's smoking rate from the group with the lowest rate, giving each group equal weight and expressed as a percentage of the rate in the group with the lowest rate. The Mean Log Deviation weights each group by its population size and is calculated as the average difference between the logarithm of each group's smoking rate and the logarithm of the population average rate of smoking (see the appendix for formulas).
Figure 3
Figure 3
Concentration Index and Index of Disparity for Education-Related Inequality in Current Smoking among U.S. Women in 1965 and 1983. Note: The Concentration Index is calculated as two times the covariance between the smoking rate of each group and its relative rank in the cumulative distribution of the population, ranked by education, divided by the population average smoking rate. The Index of Disparity is calculated as the average deviation of each group's smoking rate from the group with the lowest rate, giving each group equal weight and expressed as a percentage of the rate in the group with the lowest rate (see the appendix for formulas). Source: Authors’ calculations of National Health Interview Survey data (National Center for Health Statistics 2009b).
Figure 4
Figure 4
Concentration Index with Varying Inequality Aversion Parameters (ν) for Relative Socioeconomic Inequality in Childhood (under Five) Mortality according to Household Income Quintile, Colombia and Guatemala, 1995. Note: Country rank refers to the ranking of countries with respect to the CI, with the least negative value ranked highest. The Relative Concentration Index is calculated as two times the covariance between the mortality rate of each group and its relative rank in the cumulative distribution of the population, ranked by education and divided by the population average mortality rate (see the appendix for the formula). The parameter ν represents the weight attached to the health of the poorest group, which decreases as socioeconomic rank increases. Source: Data from Gwatkin et al. 2007, with calculations by the authors.
Figure 5
Figure 5
Effect of Changing the Reference Point for the Index of Disparity When Calculating Relative Inequality in Smoking across Four Hypothetical Groups. Note: The Index of Disparity is calculated as the average deviation of each group's smoking rate from the rate in the reference group, giving each group equal weight and expressed as a percentage of the rate in the reference group. In the first case the reference group is the group with the lowest rate of smoking, and in the second case it is the population average smoking rate.

Comment in

References

    1. Atkinson AB. On the Measurement of Inequality. Journal of Economic Theory. 1970;2:244–63.
    1. Braveman P, Krieger N, Lynch J. Health Inequalities and Social Inequalities in Health. Bulletin of the World Health Organization. 2000;78:232–34. - PMC - PubMed
    1. Chu KC, Miller BA, Springfield SA. Measures of Racial/Ethnic Health Disparities in Cancer Mortality Rates and the Influence of Socioeconomic Status. Journal of the National Medical Institute. 2007;99:1092–104. - PMC - PubMed
    1. Cook RJ, Sackett DL. The Number Needed to Treat: A Clinically Useful Measure of Treatment Effect. British Medical Journal. 1995;310:452–54. - PMC - PubMed
    1. Cowell FA. Measurement of Inequality. In: Atkinson AB, Bourguignon F, editors. Handbook of Income Distribution. Amsterdam: Elsevier; 2000. pp. 87–166.

Publication types

MeSH terms