. 2010 Apr 8:11:24.
doi: 10.1186/1471-2121-11-24.

Significantly improved precision of cell migration analysis in time-lapse video microscopy through use of a fully automated tracking system

Affiliations

Significantly improved precision of cell migration analysis in time-lapse video microscopy through use of a fully automated tracking system

Johannes Huth et al. BMC Cell Biol. .

Abstract

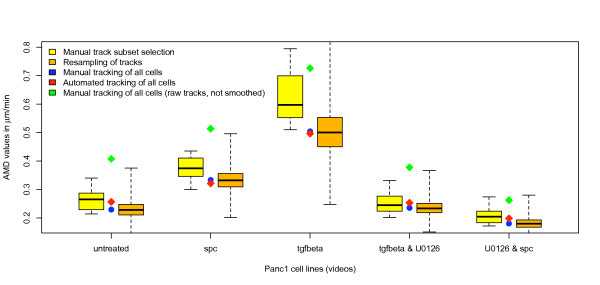
Background: Cell motility is a critical parameter in many physiological as well as pathophysiological processes. In time-lapse video microscopy, manual cell tracking remains the most common method of analyzing migratory behavior of cell populations. In addition to being labor-intensive, this method is susceptible to user-dependent errors regarding the selection of "representative" subsets of cells and manual determination of precise cell positions.

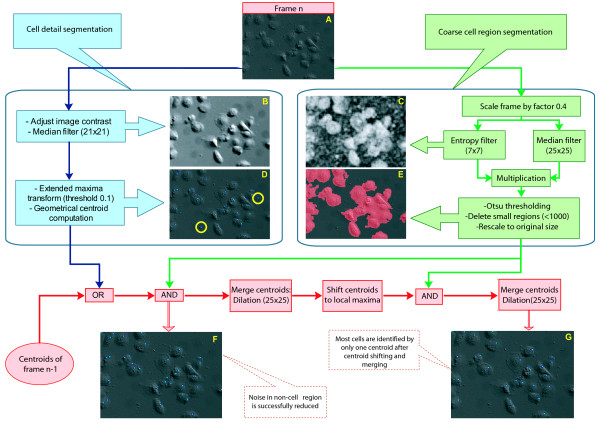
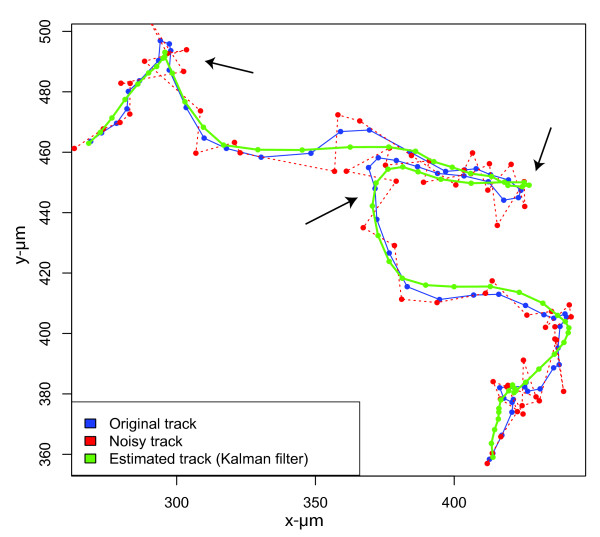
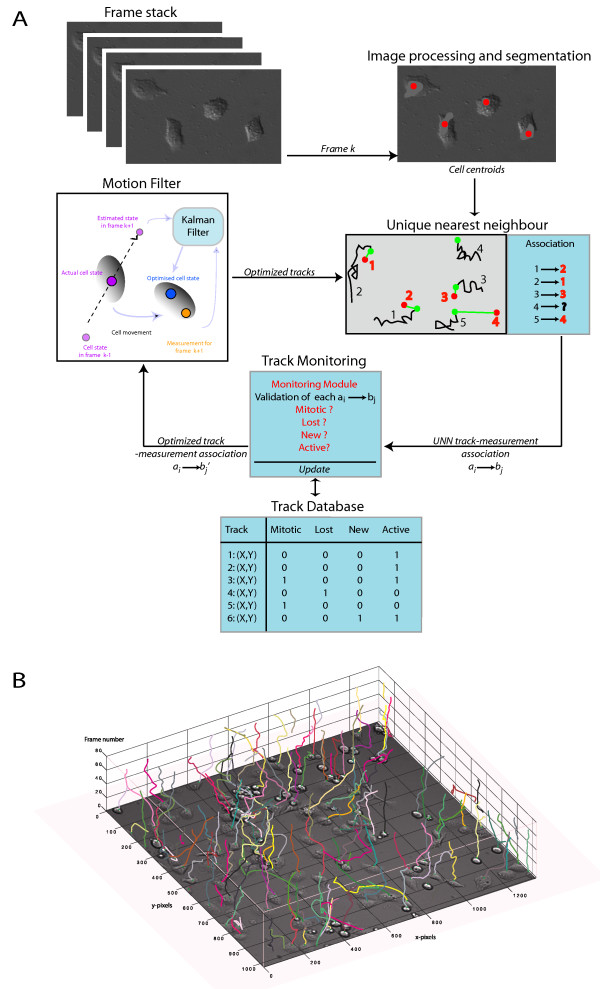
Results: We have quantitatively analyzed these error sources, demonstrating that manual cell tracking of pancreatic cancer cells lead to mis-calculation of migration rates of up to 410%. In order to provide for objective measurements of cell migration rates, we have employed multi-target tracking technologies commonly used in radar applications to develop fully automated cell identification and tracking system suitable for high throughput screening of video sequences of unstained living cells.

Conclusion: We demonstrate that our automatic multi target tracking system identifies cell objects, follows individual cells and computes migration rates with high precision, clearly outperforming manual procedures.


Figures

Figure 1
Figure 1
Dependency of average mean displacement on track selection. Variability of track set selection for average mean displacement calculation is shown for image sequences of five Panc1 cell lines treated with different compounds (spc: Sphingosylphosphorylcholine, TGFβ, U0126). All cells were tracked manually by one expert (overall track number n = 420; for cell numbers per video see Table 3). Ten subjects selected 20 of these tracks for average mean displacement calculation (yellow, boxplots showing median, interquartiles and range). Results of randomly sampling 20 of the tracks repeatedly for 2 × 10⁵ times are shown as orange boxplots. Average mean displacement values, utilizing all available manually tracked cells are shown in blue (for raw not smoothed tracks in green). Results of automated tracking are given in red.
Figure 2
Figure 2
Cell centroid segmentation. Schematic workflow and examples of intermediary steps of cell centroid extraction from microscopic images. Each new frame (A) will be processed in two distinct steps, namely cell detail segmentation (left, blue box) and cell region segmentation (right, green box). The detected centroids from the detail segmentation are first combined with the extracted centroids of one past frame to propagate cell centroids steadily through an image sequence. Afterwards the combination of the cell region image and the cell centroid image leads to deletion of cell positions in non-cell regions (panel F). Subsequent centroid merging and shifting finally concentrate groups of possible centroids within one cell to form a single cell centroid (panel G).
Figure 3
Figure 3
Kalman filter tracked cell path. The blue line displays the "ground truth" cell path without any influence of noise. The track was taken from the set of smoothed manual tracks of the first video file. The red dots indicate the noisy measurements, which were varied within a standard deviation of five pixels around the original (blue) path. The dashed red line shows the track that would result from taking the noisy measurements as real centroid positions. The track varies strongly around the original blue track. The green line displays the track derived by the Kalman Filter implemented in this project. A main part of the noise is successfully filtered with our approach so that the Kalman track appears much smoother than the track from the noisy measurement. Note that the KF with constant velocity model also performs well at major turning points of the trajectory (black arrows).
Figure 4
Figure 4
Overview of the tracking scheme. (A) In each iteration, the actual extracted cell centroids and the optimized state estimate from the Kalman filter process are used to compute the unique nearest neighbor for each track end. The unique nearest neighbor is processed in a monitoring module to check whether a cell division, cell death, or leaving of the cell out of view event might have occurred. The stored tracks are updated accordingly. All tracks that are still active are further processed: the tuple consisting of actual track end and associated unique nearest neighbor track (measurement) is used to make the next state ahead prediction using the Kalman filter. (B) Three-dimensional representation of the result of the migration analysis for a video sample derived by the automated tracking system. The extracted cell tracks are exemplarily plotted onto the first video frame. Each colored line marks the path of a single cell through the stack of images (video frames).

References

    1. Ayala R, Shu T, Tsai LH. Trekking across the brain: the journey of neuronal migration. Cell. 2007;128(1):29–43. doi: 10.1016/j.cell.2006.12.021. - DOI - PubMed
    1. Heng JI, Nguyen L, Castro DS, Zimmer C, Wildner H, Armant O, Skowronska-Krawczyk D, Bedogni F, Matter JM, Hevner R. Neurogenin 2 controls cortical neuron migration through regulation of Rnd2. Nature. 2008;455(7209):114–118. doi: 10.1038/nature07198. - DOI - PubMed
    1. Martin P, Parkhurst SM. Parallels between tissue repair and embryo morphogenesis. Development. 2004;131(13):3021–3034. doi: 10.1242/dev.01253. - DOI - PubMed
    1. Schneider IC, Haugh JM. Mechanisms of gradient sensing and chemotaxis: conserved pathways, diverse regulation. Cell Cycle. 2006;5(11):1130–1134. - PubMed
    1. Henrickson SE, Mempel TR, Mazo IB, Liu B, Artyomov MN, Zheng H, Peixoto A, Flynn MP, Senman B, Junt T. T cell sensing of antigen dose governs interactive behavior with dendritic cells and sets a threshold for T cell activation. Nat Immunol. 2008;9(3):282–291. doi: 10.1038/ni1559. - DOI - PMC - PubMed

Publication types

LinkOut - more resources