Distinct phosphatase requirements and GATA factor responses to nitrogen catabolite repression and rapamycin treatment in Saccharomyces cerevisiae
- PMID: 20378536
- PMCID: PMC2878551
- DOI: 10.1074/jbc.M109.085712
Distinct phosphatase requirements and GATA factor responses to nitrogen catabolite repression and rapamycin treatment in Saccharomyces cerevisiae
Abstract
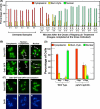
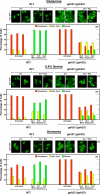
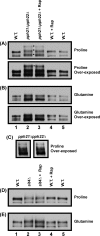
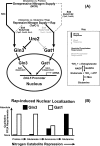
In yeast, rapamycin (Rap)-inhibited TorC1, and the phosphatases it regulates (Sit4 and PP2A) are components of a conserved pathway regulating the response of eukaryotic cells to nutrient availability. TorC1 and intracellular nitrogen levels regulate the localization of Gln3 and Gat1, the activators of nitrogen catabolite repression (NCR)-sensitive genes whose products are required to utilize poor nitrogen sources. In nitrogen excess, Gln3 and Gat1 are cytoplasmic, and NCR-sensitive transcription is repressed. During nitrogen limitation or Rap treatment, Gln3 and Gat1 are nuclear, and transcription is derepressed. We previously demonstrated that the Sit4 and Pph21/22-Tpd3-Cdc55/Rts1 requirements for nuclear Gln3 localization differ. We now show that Sit4 and Pph21/22-Tpd3-Cdc55/Rts1 requirements for NCR-sensitive and Rap-induced nuclear Gat1 localization markedly differ from those of Gln3. Our data suggest that Gln3 and Gat1 localizations are controlled by two different regulatory pathways. Gln3 localization predominantly responds to intracellular nitrogen levels, as reflected by its stronger NCR-sensitivity, weaker response to Rap treatment, and strong response to methionine sulfoximine (Msx, a glutamine synthetase inhibitor). In contrast, Gat1 localization predominantly responds to TorC1 regulation as reflected by its weaker NCR sensitivity, stronger response to Rap, and immunity to the effects of Msx. Nuclear Gln3 localization in proline-grown (nitrogen limited) cells exhibits no requirement for Pph21/22-Tpd3/Cdc55, whereas nuclear Gat1 localization under these conditions is absolutely dependent on Pph21/22-Tpd3/Cdc55. Furthermore, the extent to which Pph21/22-Tpd3-Cdc55 is required for the TorC1 pathway (Rap) to induce nuclear Gat1 localization is regulated in parallel with Pph21/22-Tpd3-Cdc55-dependent Gln3 dephosphorylation and NCR-sensitive transcription, being highest in limiting nitrogen and lowest when nitrogen is in excess.
Figures


Similar articles
-
Nitrogen-responsive regulation of GATA protein family activators Gln3 and Gat1 occurs by two distinct pathways, one inhibited by rapamycin and the other by methionine sulfoximine.J Biol Chem. 2011 Dec 30;286(52):44897-912. doi: 10.1074/jbc.M111.290577. Epub 2011 Oct 28. J Biol Chem. 2011. PMID: 22039046 Free PMC article.
-
Intranuclear function for protein phosphatase 2A: Pph21 and Pph22 are required for rapamycin-induced GATA factor binding to the DAL5 promoter in yeast.Mol Cell Biol. 2011 Jan;31(1):92-104. doi: 10.1128/MCB.00482-10. Epub 2010 Oct 25. Mol Cell Biol. 2011. PMID: 20974806 Free PMC article.
-
Sit4 and PP2A Dephosphorylate Nitrogen Catabolite Repression-Sensitive Gln3 When TorC1 Is Up- as Well as Downregulated.Genetics. 2019 Aug;212(4):1205-1225. doi: 10.1534/genetics.119.302371. Epub 2019 Jun 18. Genetics. 2019. PMID: 31213504 Free PMC article.
-
Transmitting the signal of excess nitrogen in Saccharomyces cerevisiae from the Tor proteins to the GATA factors: connecting the dots.FEMS Microbiol Rev. 2002 Aug;26(3):223-38. doi: 10.1111/j.1574-6976.2002.tb00612.x. FEMS Microbiol Rev. 2002. PMID: 12165425 Free PMC article. Review.
-
Nitrogen catabolite repression in Saccharomyces cerevisiae.Mol Biotechnol. 1999 Aug;12(1):35-73. doi: 10.1385/MB:12:1:35. Mol Biotechnol. 1999. PMID: 10554772 Review.
Cited by
-
Robustness of Nutrient Signaling Is Maintained by Interconnectivity Between Signal Transduction Pathways.Front Physiol. 2019 Jan 21;9:1964. doi: 10.3389/fphys.2018.01964. eCollection 2018. Front Physiol. 2019. PMID: 30719010 Free PMC article.
-
Regulation of entry into gametogenesis.Philos Trans R Soc Lond B Biol Sci. 2011 Dec 27;366(1584):3521-31. doi: 10.1098/rstb.2011.0081. Philos Trans R Soc Lond B Biol Sci. 2011. PMID: 22084379 Free PMC article. Review.
-
Alterations in the Ure2 αCap domain elicit different GATA factor responses to rapamycin treatment and nitrogen limitation.J Biol Chem. 2013 Jan 18;288(3):1841-55. doi: 10.1074/jbc.M112.385054. Epub 2012 Nov 26. J Biol Chem. 2013. PMID: 23184930 Free PMC article.
-
Effects of nitrogen availability on polymalic acid biosynthesis in the yeast-like fungus Aureobasidium pullulans.Microb Cell Fact. 2016 Aug 22;15(1):146. doi: 10.1186/s12934-016-0547-y. Microb Cell Fact. 2016. PMID: 27549441 Free PMC article.
-
Regulation of amino acid, nucleotide, and phosphate metabolism in Saccharomyces cerevisiae.Genetics. 2012 Mar;190(3):885-929. doi: 10.1534/genetics.111.133306. Genetics. 2012. PMID: 22419079 Free PMC article.
References
-
- Kellis M., Birren B. W., Lander E. S. (2004) Nature 428, 617–624 - PubMed
-
- Carr-Schmid A., Durko N., Cavallius J., Merrick W. C., Kinzy T. G. (1999) J. Biol. Chem. 274, 30297–30302 - PubMed
-
- Hittinger C. T., Carroll S. B. (2007) Nature 449, 677–681 - PubMed
-
- Cooper T. G. (1982) in Molecular Biology of the Yeast Saccharomyces: Metabolism and Gene Expression (Strathern J. N., Jones E. W., Broach J. R. eds) pp. 39–99, Cold Spring Harbor Laboratory, Cold Spring Harbor, New York
Publication types
MeSH terms
Substances
Grants and funding
LinkOut - more resources
Full Text Sources
Molecular Biology Databases

