. 2010 Jun 4;285(23):17965-73.
doi: 10.1074/jbc.M110.120972. Epub 2010 Apr 8.

The longin SNARE VAMP7/TI-VAMP adopts a closed conformation

Affiliations

The longin SNARE VAMP7/TI-VAMP adopts a closed conformation

Sandro Vivona et al. J Biol Chem. .

Abstract

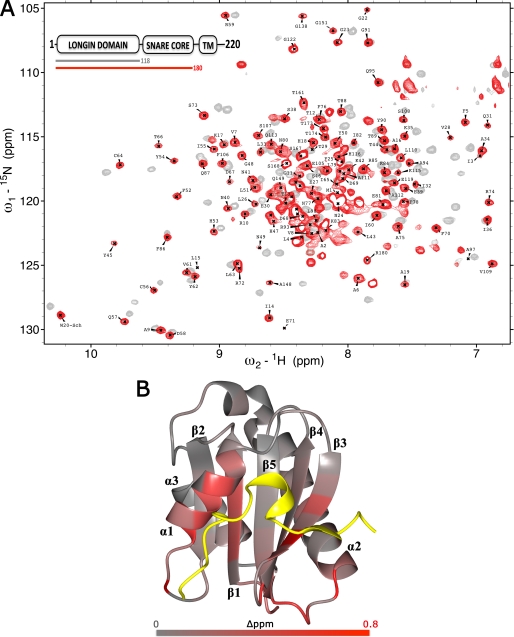
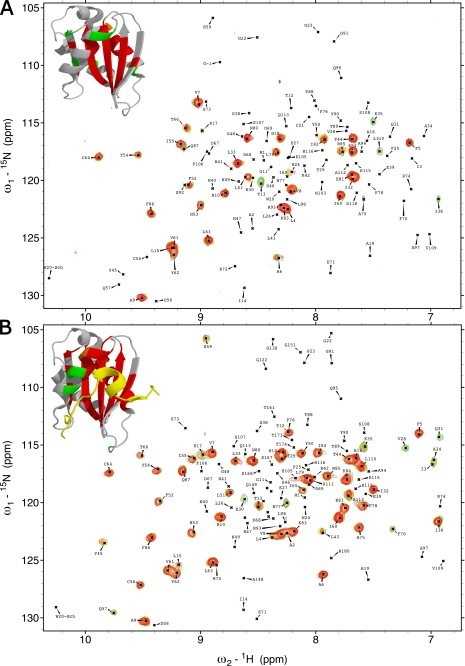
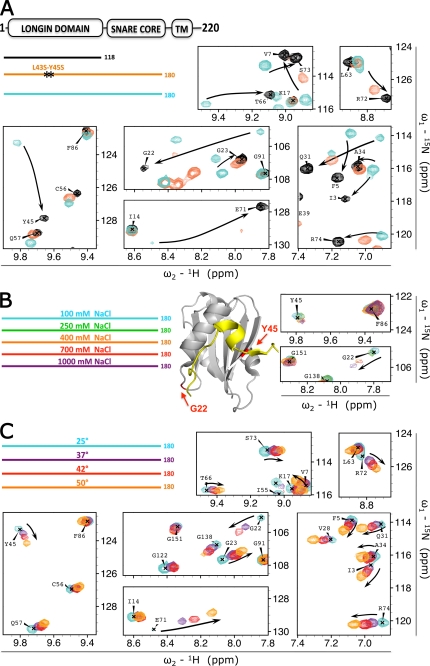
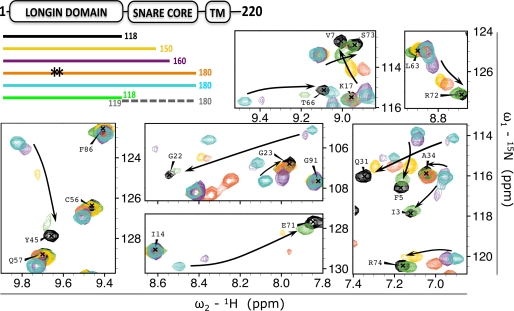
SNARE protein complexes are key mediators of exocytosis by juxtaposing opposing membranes, leading to membrane fusion. SNAREs generally consist of one or two core domains that can form a four-helix bundle with other SNARE core domains. Some SNAREs, such as syntaxin target-SNAREs and longin vesicular-SNAREs, have independent, folded N-terminal domains that can interact with their respective SNARE core domains and thereby affect the kinetics of SNARE complex formation. This autoinhibition mechanism is believed to regulate the role of the longin VAMP7/TI-VAMP in neuronal morphogenesis. Here we use nuclear magnetic resonance spectroscopy to study the longin-SNARE core domain interaction for VAMP7. Using complete backbone resonance assignments, chemical shift perturbations analysis, and hydrogen/deuterium exchange experiments, we conclusively show that VAMP7 adopts a preferentially closed conformation in solution. Taken together, the closed conformation of longins is conserved, in contrast to the syntaxin family of SNAREs for which mixtures of open and closed states have been observed. This may indicate different regulatory mechanisms for SNARE complexes containing syntaxins and longins, respectively.


Figures

FIGURE 1.
FIGURE 1.
LD-SNARE motif interaction in VAMP7. A, overlay of 1H, 15N-HSQC spectra of VAMP7(1–118) (gray) and VAMP7(1–180) (red). Only the assignments of the LD amide group of VAMP7(1–180) are shown (black labels). The color-coded bar diagram in the top left corner indicates the boundaries of the two constructs for which the spectra are shown with respect to the domain architecture of full-length VAMP7, residues 1–220: LD, SNARE core domain, and transmembrane domain (TM). B, summary of 1H and 15N combined chemical shift changes in the VAMP7 LD induced by the SNARE-motif. The combined 1H and 15N chemical shift changes are mapped on the schematic of the crystal structure of the VAMP7 LD bound to Hrb136–176 (yellow) (PDB ID 2VX8) (32) using a gray/red color scale. They are defined as Δppm = ((ΔδHN)2 + (ΔδN × αN)2)½, where ΔδHN and ΔδN are chemical shift differences of amide proton and nitrogen chemical shifts of the VAMP7 LD with and without the SNARE-motif. The scaling factor (αN) used to normalize the 1H and 15N chemical shifts is 0.17.
FIGURE 2.
FIGURE 2.
Deuterium solvent-exchange protection in VAMP7(1–118) and VAMP7(1–180). A, overlay of 1H, 15N-HSQC spectra of VAMP7(1–118) after 1 min and 25 s (green), 6 min and 15 s (orange), and 11 and 5 min and 5 s (red) from resuspension in deuterated solvent. Top left corner, the detectable resonance peaks of these three spectra are mapped on the schematic of the LD-Hrb136–176 crystal structure (PDB ID 2VX8) (32) using the colors corresponding to the three spectra. The LD peaks that were not detected due to rapid deuterium exchange are colored gray. B, overlay of 1H, 15N-HSQC spectra of VAMP7(1–180) after 1 min and 20 s (green), 6 min and 5 s (orange), and 11 min (red) from resuspension in deuterated solvent. Top left corner, the detectable resonance peaks of these three spectra are colored in the LD-Hrb136–176 as described for panel A.
FIGURE 3.
FIGURE 3.
Stability of the VAMP7 closed conformation. A, effect of different 15N-labeled recombinant constructs: VAMP7(1–118) (black), VAMP7(1–180)-L43S/Y45S (orange), and VAMP7(1–180) (cyan). The color-coded bar diagram in the top left corner indicates the boundaries of these three constructs for which the spectra are shown with respect to the domain architecture of full-length VAMP7, residues 1–220: LD, SNARE core domain, and transmembrane domain (TM). Black stars on the orange bar represent the L43S/Y45S point mutations. An overlay of the 1H{15N}-HSQC spectra of these proteins is shown with matching colors for seven representative regions of the spectra. Black arrows indicate resonance perturbation trends from closed to open conformation. B, effect of ionic strength on 15N-labeled VAMP7(1–180) in 100 mm NaCl (cyan), 250 mm NaCl (green), 400 mm NaCl (orange), 700 mm NaCl (red), and 1000 mm NaCl (purple) (legend in top left corner). Two red arrows on the ribbon diagram point to the position of residues Gly-22 and Tyr-45 in the LD (gray) as found in the crystal structure of VAMP7 LD in complex with the Hrb136–176 fragment of the protein (yellow) (PDB ID 2VX8) (32). The 1H{15N}-HSQC resonances for these 2 residues at the five saline conditions are superimposed and shown on the right with colors matching the legend. C, effect of temperature on 15N-labeled VAMP7(1–180). Spectra were acquired at 25 °C (cyan), 37 °C (purple), 42 °C (red), and 50 °C (orange) (legend in top left corner). An overlay of the 1H{15N}-HSQC spectra of VAMP7(1–180) at these temperatures is shown with the same spectral regions of panel A to illustrate the opposite shift perturbation trend (from closed toward open state) indicated by the black arrows.
FIGURE 4.
FIGURE 4.
Effect of sequence specificity, construct length, and covalent linkage on the LD-SNARE core interaction. The effect of truncation and mutation of 15N-labeled VAMP7 constructs on LD resonances is shown as follows: VAMP7(1–118) (black), VAMP7(1–150) (yellow), VAMP7(1–160) (purple), VAMP7(1–180)-L43S/Y45S (orange), VAMP7(1–180) (cyan), and VAMP7(1–118) (green) incubated with non-labeled VAMP7(119–180) (dashed gray line). The color-coded bar diagram in the top left corner indicates the boundaries of these six constructs for which the spectra are shown with respect to the domain architecture of full-length VAMP7, residues 1–220: LD, SNARE core domain, and transmembrane domain (TM). Black stars on the orange bar represent the L43S/Y45S mutation from the canonical amino acid sequence of VAMP7. An overlay of the 1H{15N}-HSQC spectra of these proteins is shown with matching colors in seven representative regions of the spectra (same regions shown in Fig. 3, A and C). The three panels on the left are shown with lower contour levels to display broadened resonances. Black arrows indicate the chemical shift perturbation trends from the closed to the open conformation.

Similar articles

Cited by

References

    1. Sutton R. B., Fasshauer D., Jahn R., Brunger A. T. (1998) Nature 395, 347–353 - PubMed
    1. Liu W., Parpura V. (2009) Front. Neuroenergetics 1, 5. - PMC - PubMed
    1. Fasshauer D., Sutton R. B., Brunger A. T., Jahn R. (1998) Proc. Natl. Acad. Sci. U.S.A. 95, 15781–15786 - PMC - PubMed
    1. Brunger A. T. (2005) Q. Rev. Biophys. 38, 1–47 - PubMed
    1. Jahn R., Scheller R. H. (2006) Nat. Rev. Mol. Cell Biol. 7, 631–643 - PubMed

Publication types

LinkOut - more resources