. 2011 Jan;21(1):48-55.
doi: 10.1093/cercor/bhq059. Epub 2010 Apr 8.

The neural processes underlying self-agency

Affiliations

The neural processes underlying self-agency

Fatta B Nahab et al. Cereb Cortex. 2011 Jan.

Abstract

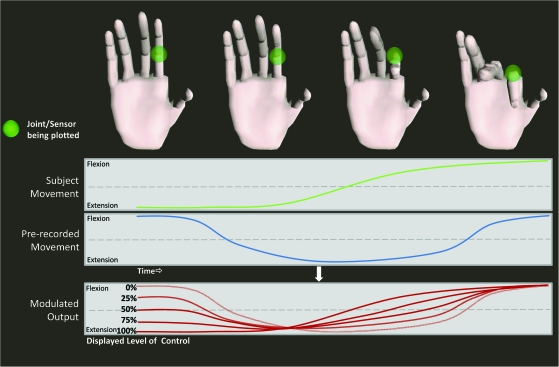
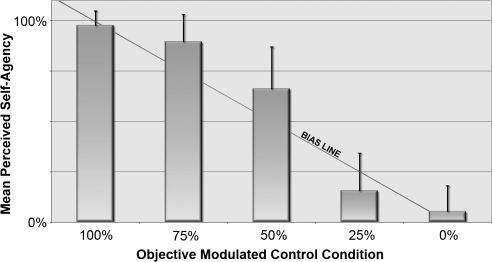
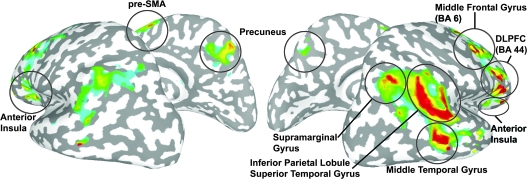
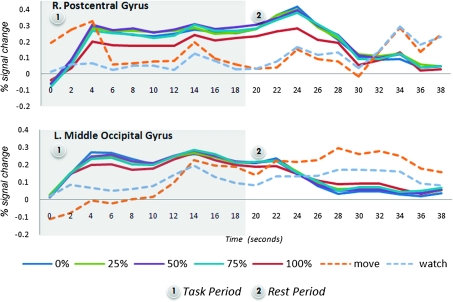
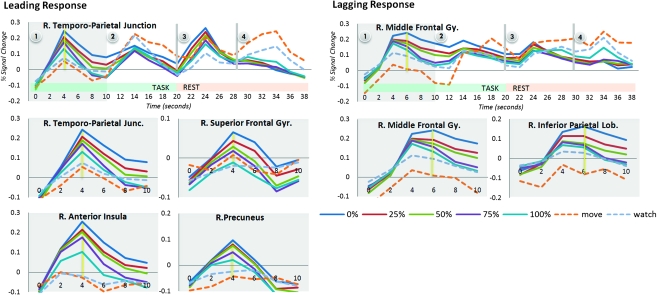
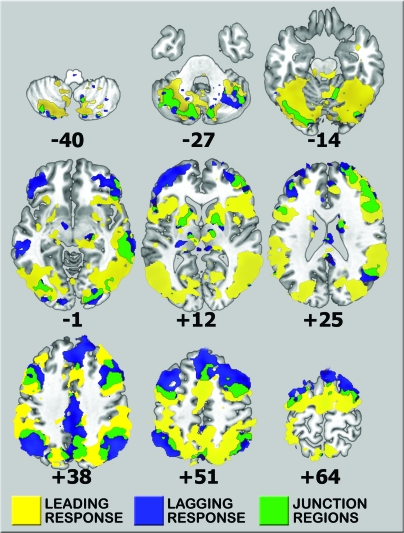
Self-agency (SA) is the individual's perception that an action is the consequence of his/her own intention. The neural networks underlying SA are not well understood. We carried out a novel, ecologically valid, virtual-reality experiment using blood oxygen level-dependent functional magnetic resonance imaging (fMRI) where SA could be modulated in real-time while subjects performed voluntary finger movements. Behavioral testing was also performed to assess the explicit judgment of SA. Twenty healthy volunteers completed the experiment. Results of the behavioral testing demonstrated paradigm validity along with the identification of a bias that led subjects to over- or underestimate the amount of control they had. The fMRI experiment identified 2 discrete networks. These leading and lagging networks likely represent a spatial and temporal flow of information, with the leading network serving the role of mismatch detection and the lagging network receiving this information and mediating its elevation to conscious awareness, giving rise to SA.


Figures

Figure 1.
Figure 1.
Demonstration of virtual-reality paradigm showing the joint angle data from one of 18 total sensors while the subject performs the sequential finger movements. The level of SA is modulated based on the relative contribution of the subject's actual data with a prerecorded set of movements to produce the output of the model hand seen by the subject. Note the actual paradigm performs these calculations for all 18 sensors simultaneously.
Figure 2.
Figure 2.
Results of the behavioral experiment showing the group mean perceived level of SA for each objective level of control (error bars = SD). Line represents the point where SA matches the objective level of control provided by the paradigm. Subject report of SA was highly consistent and demonstrated a bias toward greater SA at the 50% or greater control and a bias toward less SA at 25% control.
Figure 3.
Figure 3.
Linear trend map of regions responding proportionally to the loss of SA displayed on an inflated standard brain (P = 0.05, corrected). The response to the loss of SA was mediated by bilateral brain regions, though the right hemisphere produced preferentially larger and more proportional responses.
Figure 4.
Figure 4.
Mean BOLD response time courses for primary sensorimotor and middle occipital cortices. These regions showed a nonproportional task response to the modulation of SA. The hemodynamic response function (HRF) for the move control condition was greatest in the motor region, while the HRF for the watch control condition was of a greater magnitude in the visual cortex. The 100% control condition was associated with a slightly smaller HRF than the remaining levels of control, though the 0–75% conditions could not be differentiated from one another.
Figure 5.
Figure 5.
Mean BOLD response time courses for regions showing proportional responsivity to the level of control as SA were lost. The hemodynamic response functions for these loss-responsive regions showed either of 2 response profiles: leading or lagging. Leading regions showed response peaks at 4, 14, and 24 s after stimulus onset, while lagging regions showed more subtle peaks and a slower return to baseline.
Figure 6.
Figure 6.
Functional connectivity analysis utilizing seeds from the loss-responsive regions. Leading (yellow) and lagging (blue) response regions demonstrate separate functional networks that are internally coherent. Additional relay regions (green) that are anatomically intermediate to the leading and lagging networks demonstrate high correlation values to both networks.

Similar articles

Cited by

References

    1. Blakemore SJ, Sirigu A. Action prediction in the cerebellum and in the parietal lobe. Exp Brain Res. 2003;53:239–245. - PubMed
    1. Brass M, Haggard P. To do or not to do: the neural signature of self-control. J Neurosci. 2007;27:9141–9145. - PMC - PubMed
    1. Cohen MS. Parametric analysis of fMRI data using linear systems methods. Neuroimage. 1997;6:93–103. - PubMed
    1. Costantini M, Haggard P. The rubber hand illusion: sensitivity and reference frame for body ownership. Conscious Cogn. 2007;16:229–240. - PubMed
    1. Cox RW. AFNI: Software for analysis and visualization of functional magnetic resonance neuroimages. Computers and Biomedical Research. 1996;29:162–173. - PubMed

Publication types