

Seven direct methods for measuring HDL and LDL cholesterol compared with ultracentrifugation reference measurement procedures
- PMID: 20378768
- PMCID: PMC4687457
- DOI: 10.1373/clinchem.2009.142810
Seven direct methods for measuring HDL and LDL cholesterol compared with ultracentrifugation reference measurement procedures
Abstract
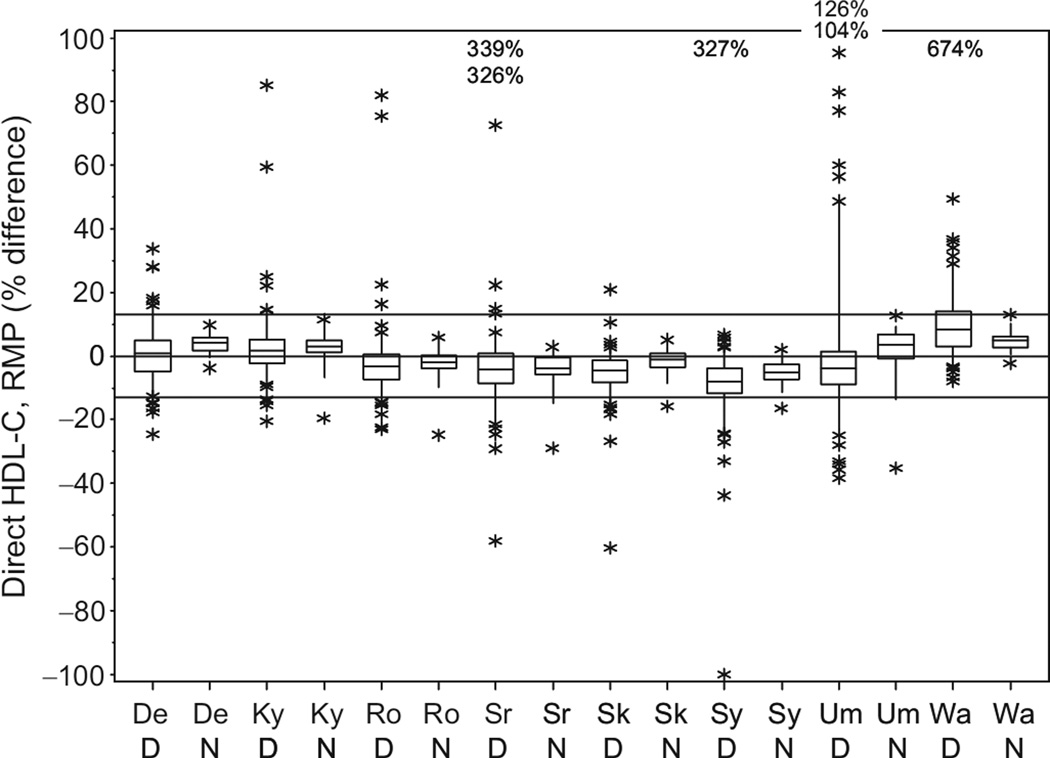
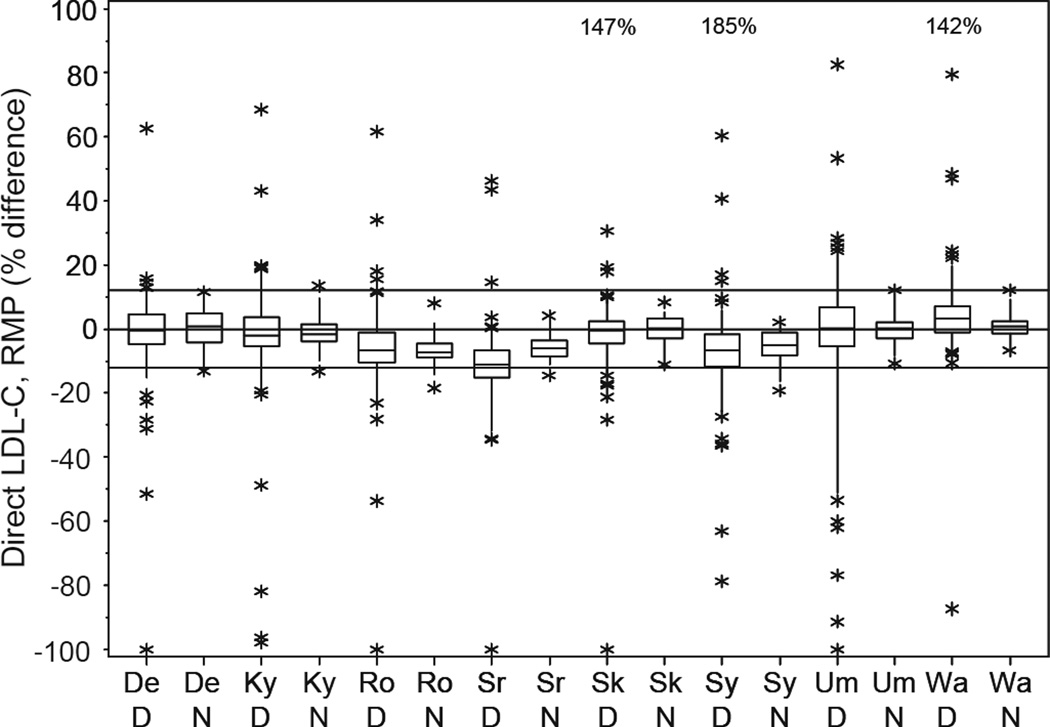
Background: Methods from 7 manufacturers and 1 distributor for directly measuring HDL cholesterol (C) and LDL-C were evaluated for imprecision, trueness, total error, and specificity in nonfrozen serum samples.
Methods: We performed each direct method according to the manufacturer's instructions, using a Roche/Hitachi 917 analyzer, and compared the results with those obtained with reference measurement procedures for HDL-C and LDL-C. Imprecision was estimated for 35 runs performed with frozen pooled serum specimens and triplicate measurements on each individual sample. Sera from 37 individuals without disease and 138 with disease (primarily dyslipidemic and cardiovascular) were measured by each method. Trueness and total error were evaluated from the difference between the direct methods and reference measurement procedures. Specificity was evaluated from the dispersion in differences observed.
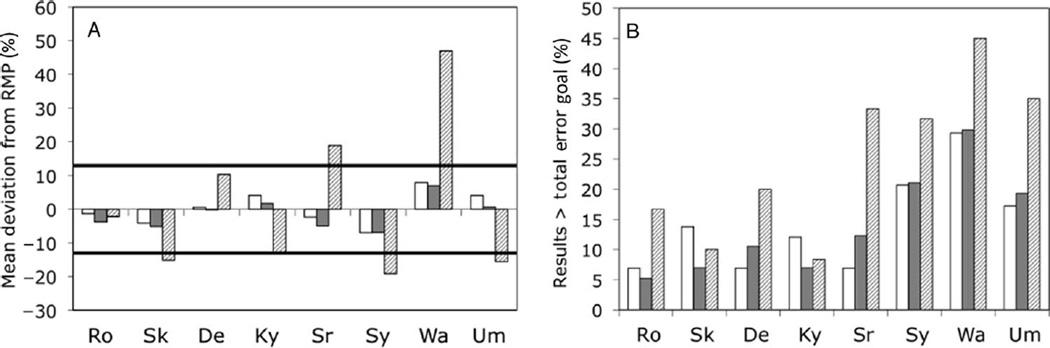
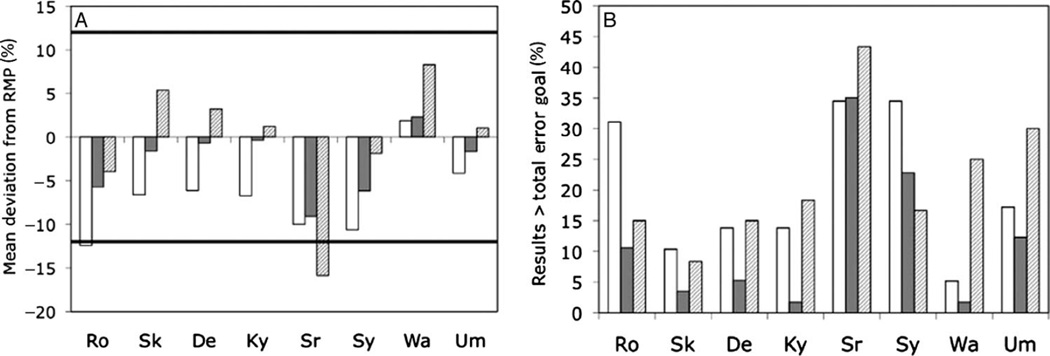
Results: Imprecision data based on 4 frozen serum pools showed total CVs <3.7% for HDL-C and <4.4% for LDL-C. Bias for the nondiseased group ranged from -5.4% to 4.8% for HDL-C and from -6.8% to 1.1% for LDL-C, and for the diseased group from -8.6% to 8.8% for HDL-C and from -11.8% to 4.1% for LDL-C. Total error for the nondiseased group ranged from -13.4% to 13.6% for HDL-C and from -13.3% to 13.5% for LDL-C, and for the diseased group from -19.8% to 36.3% for HDL-C and from -26.6% to 31.9% for LDL-C.
Conclusions: Six of 8 HDL-C and 5 of 8 LDL-C direct methods met the National Cholesterol Education Program total error goals for nondiseased individuals. All the methods failed to meet these goals for diseased individuals, however, because of lack of specificity toward abnormal lipoproteins.
Conflict of interest statement
Figures
Comment in
-
Limitations of direct methods and the reference method for measuring HDL and LDL cholesterol.Clin Chem. 2011 Jul;57(7):1081-3; author reply 1083. doi: 10.1373/clinchem.2010.159483. Epub 2011 Mar 28. Clin Chem. 2011. PMID: 21444737 No abstract available.
Similar articles
-
Difference in bias approach for commutability assessment: application to frozen pools of human serum measured by 8 direct methods for HDL and LDL cholesterol.Clin Chem. 2015 Aug;61(8):1107-13. doi: 10.1373/clinchem.2015.240861. Epub 2015 Jun 12. Clin Chem. 2015. PMID: 26071490
-
Non-HDL cholesterol shows improved accuracy for cardiovascular risk score classification compared to direct or calculated LDL cholesterol in a dyslipidemic population.Clin Chem. 2011 Mar;57(3):490-501. doi: 10.1373/clinchem.2010.154773. Epub 2011 Jan 12. Clin Chem. 2011. PMID: 21228254 Free PMC article.
-
[Multicenter evaluation on different analyzers of three methods for direct HDL-cholesterol assay].Ann Biol Clin (Paris). 1999 Sep-Oct;57(5):561-72. Ann Biol Clin (Paris). 1999. PMID: 10518058 French.
-
Reliability of low-density lipoprotein cholesterol, non-high-density lipoprotein cholesterol, and apolipoprotein B measurement.J Clin Lipidol. 2011 Jul-Aug;5(4):264-72. doi: 10.1016/j.jacl.2011.05.004. Epub 2011 May 27. J Clin Lipidol. 2011. PMID: 21784371 Review.
-
[Pitfalls in homogeneous assays for HDL-c and LDL-c in serum].Rinsho Byori. 2005 Feb;53(2):138-43. Rinsho Byori. 2005. PMID: 15796047 Review. Japanese.
Cited by
-
Are caveolin-1 minor alleles more likely to be risk alleles in insulin resistance mechanisms in metabolic diseases?BMC Res Notes. 2021 May 17;14(1):185. doi: 10.1186/s13104-021-05597-6. BMC Res Notes. 2021. PMID: 34001235 Free PMC article.
-
Which LDL Value Should Clinicians Look at?J Lab Physicians. 2021 Jun;13(2):129-133. doi: 10.1055/s-0041-1729131. Epub 2021 May 26. J Lab Physicians. 2021. PMID: 34483557 Free PMC article.
-
Lipids and Cerebrovascular Disease: Research and Practice.Stroke. 2015 Nov;46(11):3322-8. doi: 10.1161/STROKEAHA.115.011164. Epub 2015 Oct 8. Stroke. 2015. PMID: 26451029 Free PMC article. Review. No abstract available.
-
Fibre Intake Is Associated with Cardiovascular Health in European Children.Nutrients. 2020 Dec 23;13(1):12. doi: 10.3390/nu13010012. Nutrients. 2020. PMID: 33374515 Free PMC article.
-
Maternal Quercetin Consumption during Pregnancy May Help Regulate Total Cholesterol/HDL-Cholesterol Ratio without Effect on Cholesterol Levels in Male Progeny Consuming High-Fat Diet.Nutrients. 2021 Apr 9;13(4):1242. doi: 10.3390/nu13041242. Nutrients. 2021. PMID: 33918820 Free PMC article.
References
-
- Executive summary of the third report of the National Cholesterol Education Program (NCEP) expert panel on detection, evaluation, and treatment of high blood cholesterol in adults (Adult Treatment Panel III) JAMA. 2001;285:2486–2497. - PubMed
-
- Daniels SR, Greer FR Committee on Nutrition. Lipid screening and cardiovascular health in childhood. Pediatrics. 2008;122:198–208. - PubMed
-
- National Cholesterol Education Program. Recommendations on lipoprotein measurement: from the Working Group on Lipoprotein Measurement. Bethesda (MD): NIH, National Heart, Lung, and Blood Institute; 1995. [Accessed April 2010]. p. 186. Available at: www.lassa.org.za/guidelines/lipoprot.pdf. NIH publication no. 95-3044.
-
- Nauck M, Warnick GR, Rifai N. Methods for measurement of LDL-cholesterol: a critical assessment of direct measurement by homogeneous assays versus calculation. Clin Chem. 2002;48:236–254. - PubMed
-
- Warnick GR, Nauck M, Rifai N. Evolution of methods for measurement of HDL-cholesterol: from ultracentrifugation to homogeneous assays. Clin Chem. 2001;47:1579–1596. - PubMed
Publication types
MeSH terms
Substances
Grants and funding
LinkOut - more resources
Full Text Sources
Other Literature Sources
Medical
Miscellaneous
