. 2010 May;21(5):794-802.
doi: 10.1681/ASN.2009080851. Epub 2010 Apr 8.

Inhibition of histone deacetylase expands the renal progenitor cell population

Affiliations

Inhibition of histone deacetylase expands the renal progenitor cell population

Eric D de Groh et al. J Am Soc Nephrol. 2010 May.

Abstract

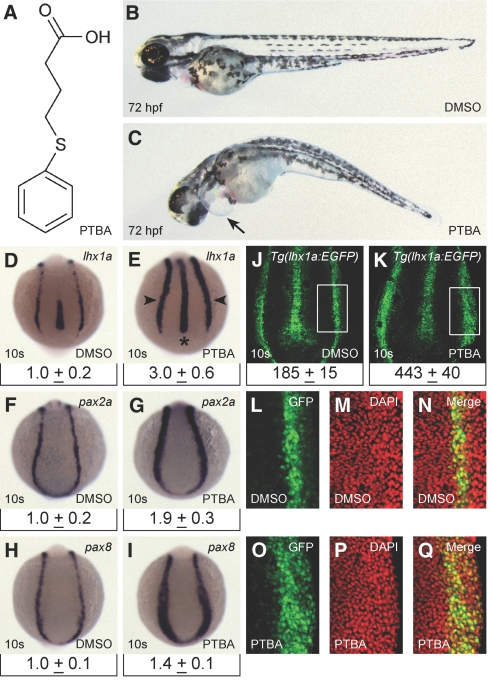
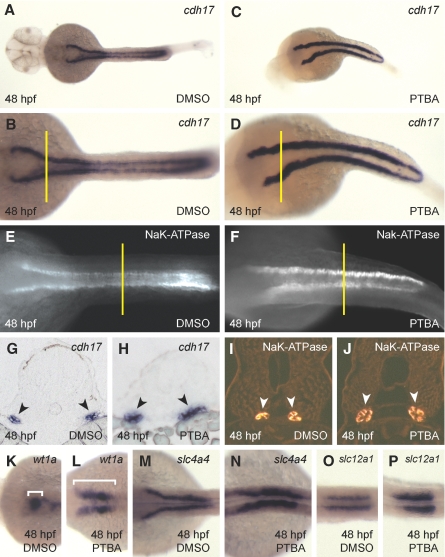
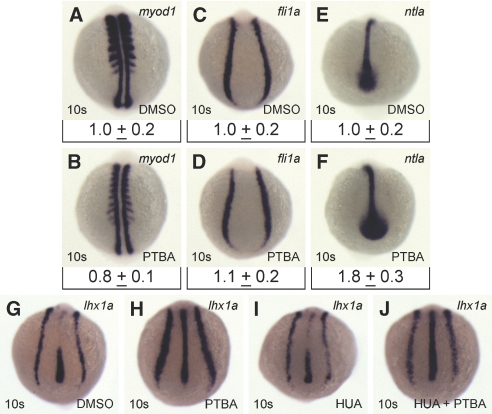
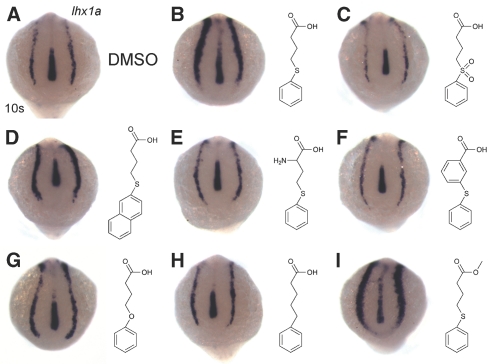
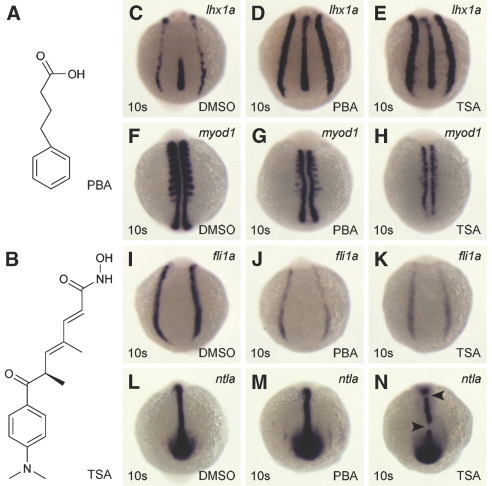
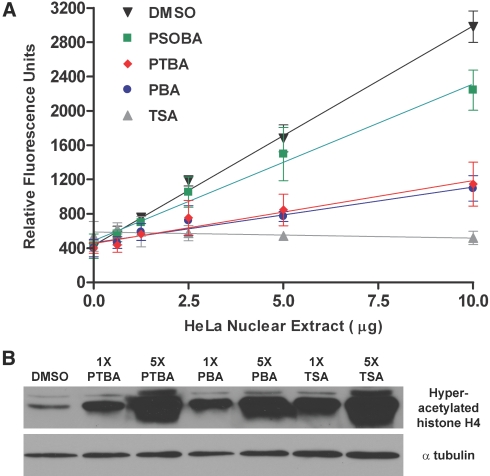
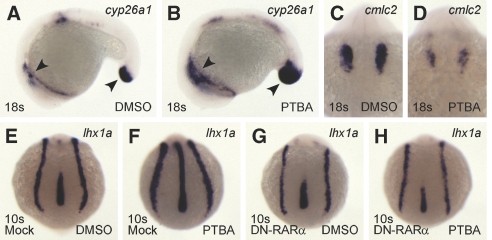
One of the first hallmarks of kidney regeneration is the reactivation of genes normally required during organogenesis. Identification of chemicals with the potential to enhance this reactivation could therapeutically promote kidney regeneration. Here, we found that 4-(phenylthio)butanoic acid (PTBA) expanded the expression domains of molecular markers of kidney organogenesis in zebrafish. PTBA exhibits structural and functional similarity to the histone deacetylase (HDAC) inhibitors 4-phenylbutanoic acid and trichostatin A; treatment with these HDAC inhibitors also expanded the renal progenitor cell population. Analyses in vitro and in vivo confirmed that PTBA functions as an inhibitor of HDAC activity. Furthermore, PTBA-mediated renal progenitor cell expansion required retinoic acid signaling. In summary, these results support a mechanistic link among renal progenitor cells, HDAC, and the retinoid pathway. Whether PTBA holds promise as a therapeutic agent to promote renal regeneration requires further study.


Figures

Figure 1.
Figure 1.
PTBA treatment expands the pool of renal progenitor cells. (A) Structure of PTBA. (B and C) Zebrafish larvae at 72 hpf treated with 0.5% DMSO (B) or 3 μM PTBA (C). Arrow indicates pericardial edema. (D through I) In situ hybridization for lhx1a (D and E), pax2a (F and G), pax8 (H and I), in 10-somite embryos treated with 0.5% DMSO (D, F, and H) or 3 μM PTBA (E, G, and I). As compared with controls (n = 60 [D], n = 60 [F], and n = 59 [H]), observed expansion in response to PTBA treatment is 95% for lhx1a (n = 60 [E]), 97% for pax2a (n = 60 [G]), and 95% for pax8 (n = 59 [I]). Arrowheads indicate renal progenitor cells, asterisk indicates notochord. Relative qPCR for lhx1a, pax2a, and pax8 in the trunk region of 10-somite embryos (n = 4, 240 embryos) is displayed under corresponding in situ image. Data are mean expression plus 95% confidence interval. Expression is normalized to β-actin and SDHA transcript levels. (J through O) Confocal projections of 10-somite Tg(lhx1a:EGFP)pt303 embryos treated with 0.5% DMSO (n = 18 [J and L through N]) or 3 μM PTBA (n = 21 [K and O through Q]). Boxed areas are regions that were counted for GFP- and DAPI-positive nuclei (J and K) and are shown in L and O (GFP), M and P (DAPI), and N and Q (merge). Cell counts are mean number of positive cells plus 95% confidence interval for each condition (J and K).
Figure 2.
Figure 2.
PTBA treatment results in a persistent expansion of the kidney field. (A through D) In situ hybridization for cdh17 expression in embryos at 48 hpf treated with 0.5% DMSO (A [higher magnification in B]) or 3 μM PTBA (C [higher magnification in D]). As compared with controls (n = 54 [A and B]), 89% of PTBA-treated embryos exhibit expansion of cdh17 expression at 48 hpf (n = 56 [C and D]). (E and F) Whole-mount antibody staining for NaK-ATPase in embryos at 48 hpf treated with 0.5% DMSO (E) or 3 μM PTBA (F). As compared with controls (n = 10 [E]), 100% of PTBA-treated embryos exhibit expansion of NaK-ATPase expression at 48 hpf (n = 10 [F]). (G and H) Proximal tubule cross-sections (5 μm) taken from cdh17 in situ hybridization of embryos at 48 hpf treated with 0.5% DMSO (G) or 3 μM PTBA (H). Black arrowheads indicate cdh17 expression. Cross-sections are taken from the location indicated in B and D by yellow lines. (I and J) Distal tubule cross-sections (5 μm) taken from NaK-ATPase antibody-stained embryos at 48 hpf treated with 0.5% DMSO (I) or 3 μM PTBA (J). White arrowheads indicate NaK-ATPase protein expression. Cross-sections are taken from the locations indicated in E and F by yellow lines. (K through P) In situ hybridization for wt1a (K and L), slc4a4 (M and N), and slc12a1 (O and P) in embryos at 48 hpf treated with 0.5% DMSO (K, M, and O) or 3 μM PTBA (L, N, and P). As compared with controls (n = 57 [K], n = 58 [M], and n = 56 [O]), observed expansion in response to PTBA treatment is 74% for wt1a (n = 50 [L]), 92% for slc4a4 (n = 60 [N]), and 64% for slc12a1 (n = 59 [P]). Brackets in K and L indicate the expression domain of wt1a.
Figure 3.
Figure 3.
The efficacy of PTBA requires renal progenitor cell proliferation. (A through F) In situ hybridization for the mesodermal markers myod1 (A and B), fli1a (C and D), and ntla (E and F) in 10-somite embryos treated with 0.5% DMSO (A, C, and E) or 3 μM PTBA (B, D, and F). As compared with controls (n = 60 [A]), myod1 expression is reduced in 95% of PTBA-treated embryos (n = 60 [B]). As compared with controls (n = 59 [C]), fli1a expression is unaffected in 97% of PTBA-treated embryos (n = 60 [D]). As compared with controls (n = 59 [E]), ntla expression is increased in 88% of PTBA-treated embryos (n = 60 [F]). Relative qPCR for myod1, fli1a, and ntla in the trunk region of 10-somite embryos (n = 4, 240 embryos) is displayed under corresponding in situ image. Data are mean expression plus 95% confidence interval. Expression was normalized to β-actin and SDHA transcript levels. (G through J) In situ hybridization for lhx1a expression in 10-somite embryos treated at 5 hpf with 0.5% DMSO (n = 136 [G]), 3 μM PTBA (n = 123 [H]), HUA (n = 131 [I]), or HUA and 3 μM PTBA (n = 104 [J]). As compared with controls (G), lhx1a expression is increased in 97% of PTBA-treated embryos (H) and 13% of the HUA-PTBA–treated embryos (J).
Figure 4.
Figure 4.
Structure-activity relationship studies reveal essential moieties for PTBA efficacy. (A through I) In situ hybridization for lhx1a expression in 10-somite embryos treated with 0.5% DMSO (n = 53 [A]) or 3 μM of the following compounds: PTBA (100% expansion, n = 52 [B]), PSOBA (no expansion, n = 54 [C]), 4-(naphthalen-2-yl thio)butanoic acid (33% expansion, n = 39 [D]), 2-amino-PTBA (no expansion, n = 64 [E]), 3-(phenylthio)benzoic acid (no expansion, n = 53 [F]), 4-phenoxybutanoic acid (13% expansion, n = 56 [G]), 5-phenylpentanoic acid (no expansion, n = 55 [H]), and methyl-4-(phenylthio)butanoate (100% expansion, n = 41 [I]).
Figure 5.
Figure 5.
Known HDACis expand the pool of renal progenitor cells. (A) Structure of PBA. (B) Structure of TSA. (C through N) In situ hybridization for lhx1a (C through E), myod1 (F through H), fli1a (I through K), ntla (L through N) in 10-somite embryos treated with 0.5% DMSO (C, F, I, and L), 25 μM PBA (D, G, J, and M), or 200 nM TSA (E, H, K, and N). As compared with controls (n = 59 [C]), lhx1a expression is increased in 72% of PBA-treated embryos (n = 56 [D]) and 89% of TSA-treated embryos (n = 58 [E]). As compared with controls (n = 60 [F]), myod1 expression is decreased in 57% of PBA-treated embryos (n = 53 [G]) and 100% of TSA-treated embryos (n = 54 [H]). As compared with controls (n = 54 [I]), fli1a expression is decreased in 78% of PBA-treated embryos (n = 54 [J]) and 95% of TSA-treated embryos (n = 55 [K]). As compared with controls (n = 55 [L]), ntla expression is increased in 87% of PBA-treated embryos (n = 52 [M]) and is disrupted in 86% of TSA-treated embryos (n = 56 [N]). Arrowheads indicate breaks in ntla expression.
Figure 6.
Figure 6.
PTBA inhibits HDAC activity both in vitro and in vivo. (A) Fluorescence histone deacetylation assay performed in the presence of 5 mM PTBA, 5 mM PBA, 5 mM PSOBA, 1 μM TSA, or 5% DMSO. At a given concentration of nuclear extract, less fluorescence is indicative of less HDAC activity. Error bars represent the 95% confidence intervals for each data point. (B) Western blot examining the acetylation state of histone H4 isolated from embryos at 30 hpf that had been treated for 6 hours with 0.5% DMSO, 3 μM (1×) or 15 μM (5×) PTBA, 25 μM (1×) or 125 μM (5×) PBA, and 200 nM (1×) or 1 μM (5×) TSA. Western blot for α-tubulin demonstrates equal loading.
Figure 7.
Figure 7.
PTBA efficacy is mediated by RA signaling. (A through D) In situ hybridization for cyp26a1 (A and B) and cmlc2 (C and D) in 18-somite embryos treated with 0.5% DMSO (A and C) or 3 μM PTBA (B and D). As compared with controls (n = 58 [A]), cyp26a1 expression is increased in 100% of PTBA-treated embryos (n = 57 [B]). Arrowheads highlight expression domains in cyp26a1 embryos. As compared with controls (n = 58 [C]), cmlc2 expression is decreased in 100% of PTBA-treated embryos (n = 57 [D]). (E through H) In situ hybridization for lhx1a in 10-somite embryos mock-injected with 1% fluorescein dextran (E and F) or injected with 200 pg of DN-RARα mRNA and 1% fluorescein dextran (G and H). At 5 hpf, embryos were treated with 0.5% DMSO (E and G) or 3 μM PTBA (F and H). As compared with controls (n = 80 [E]), lhx1a expression increased in 93% of the mock-injected PTBA-treated embryos (n = 78 [F]) and 19% of DN-RARα-injected PTBA-treated embryos (n = 125 [H]). Normal lhx1a expression is apparent in 92% of the control embryos injected with the DN-RARα construct (n = 130 [G]).

Comment in

References

    1. Burns CG, Milan DJ, Grande EJ, Rottbauer W, MacRae CA, Fishman MC: High-throughput assay for small molecules that modulate zebrafish embryonic heart rate. Nat Chem Biol 1: 263–264, 2005. - PubMed
    1. Vogt A, Cholewinski A, Shen X, Nelson SG, Lazo JS, Tsang M, Hukriede NA: Automated image-based phenotypic analysis in zebrafish embryos. Dev Dyn 238: 656–663, 2009. - PMC - PubMed
    1. Peterson RT, Shaw SY, Peterson TA, Milan DJ, Zhong TP, Schreiber SL, MacRae CA, Fishman MC: Chemical suppression of a genetic mutation in a zebrafish model of aortic coarctation. Nat Biotechnol 22: 595–599, 2004. - PubMed
    1. Stern HM, Murphey RD, Shepard JL, Amatruda JF, Straub CT, Pfaff KL, Weber G, Tallarico JA, King RW, Zon LI: Small molecules that delay S phase suppress a zebrafish bmyb mutant. Nat Chem Biol 1: 366–370, 2005. - PubMed
    1. Yeh JR, Munson KM, Chao YL, Peterson QP, Macrae CA, Peterson RT: AML1-ETO reprograms hematopoietic cell fate by downregulating scl expression. Development 135: 401–410, 2008. - PubMed

Publication types

LinkOut - more resources