

Osteochondral interface tissue engineering using macroscopic gradients of bioactive signals
- PMID: 20379780
- PMCID: PMC3773241
- DOI: 10.1007/s10439-010-0028-0
Osteochondral interface tissue engineering using macroscopic gradients of bioactive signals
Abstract
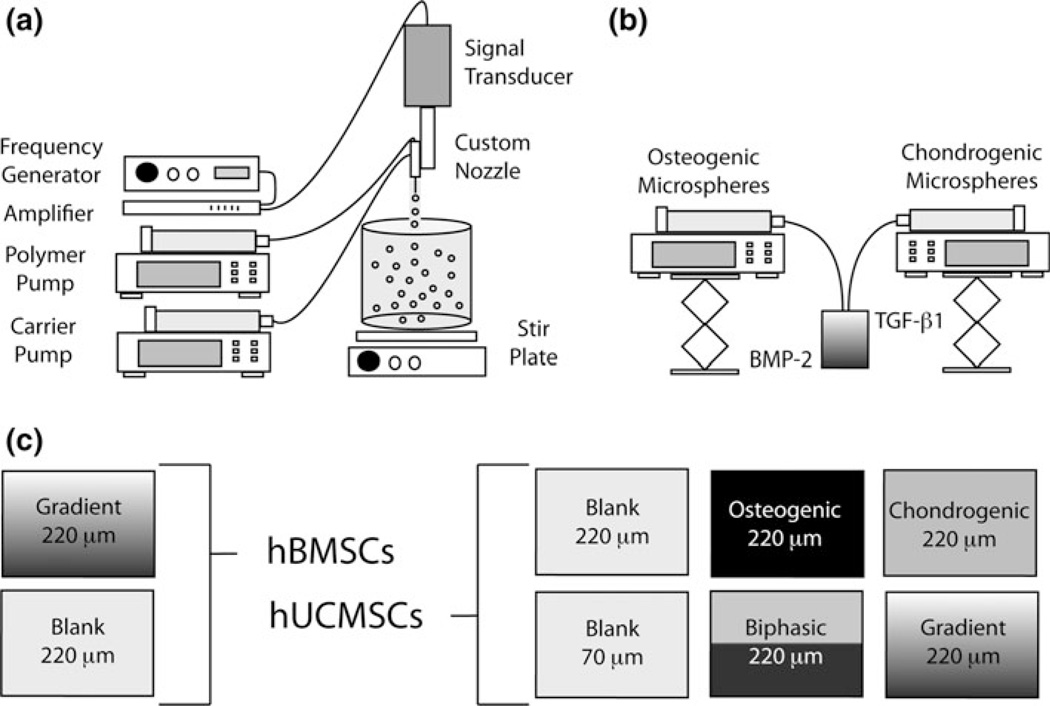
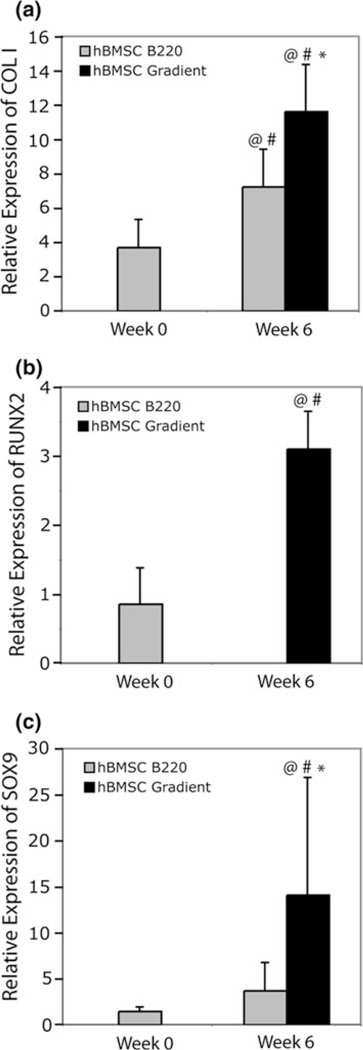
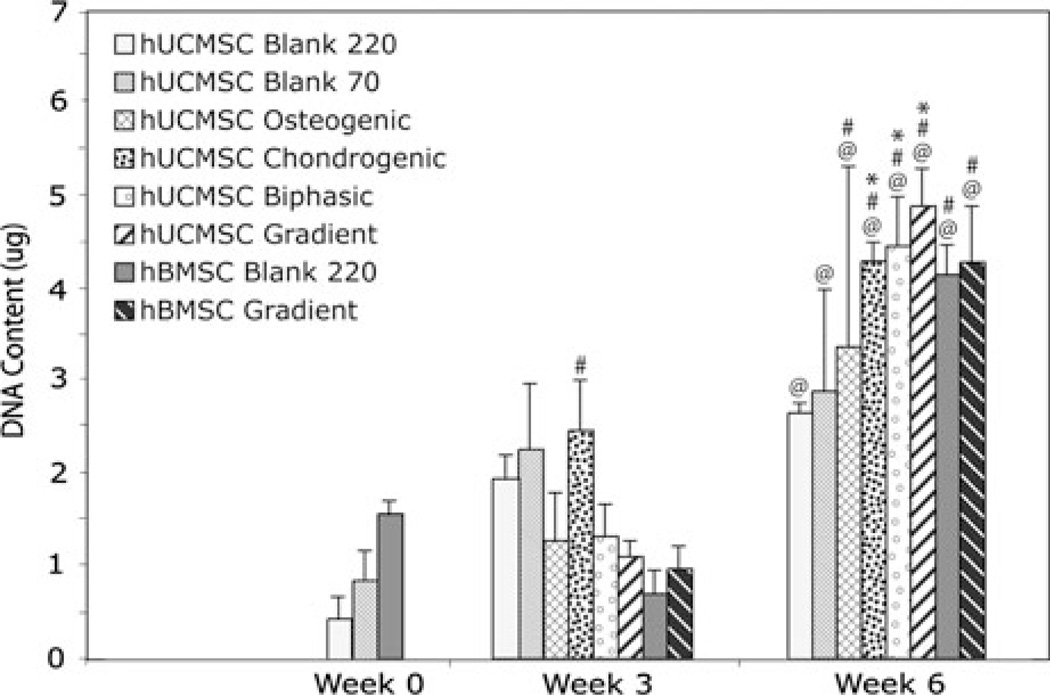
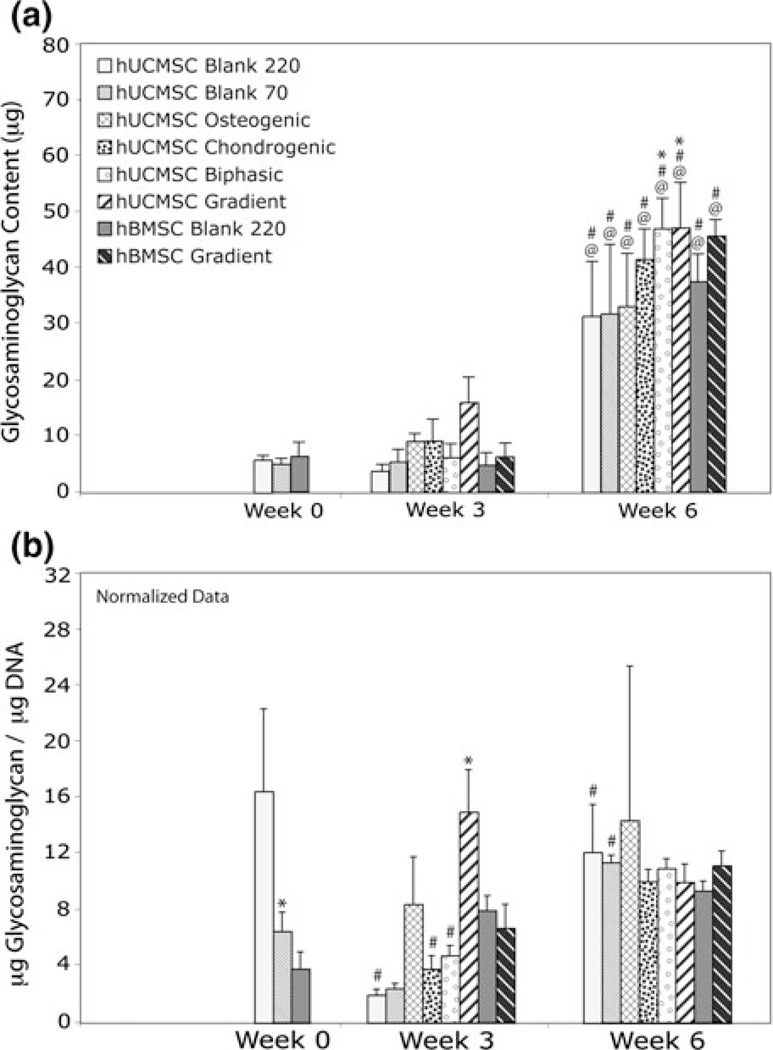
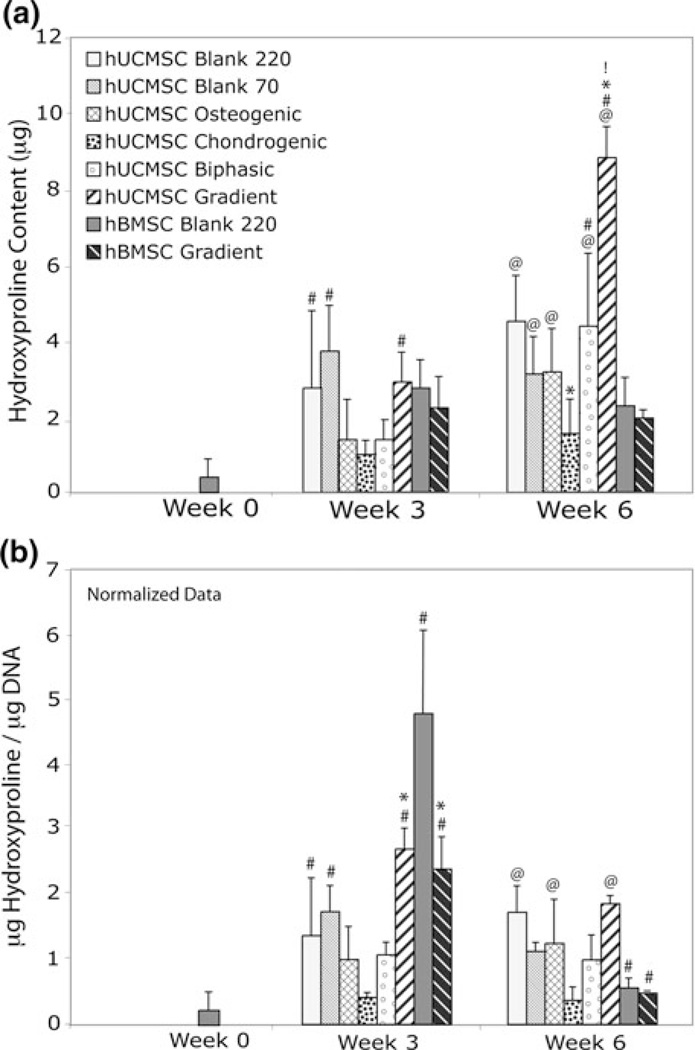
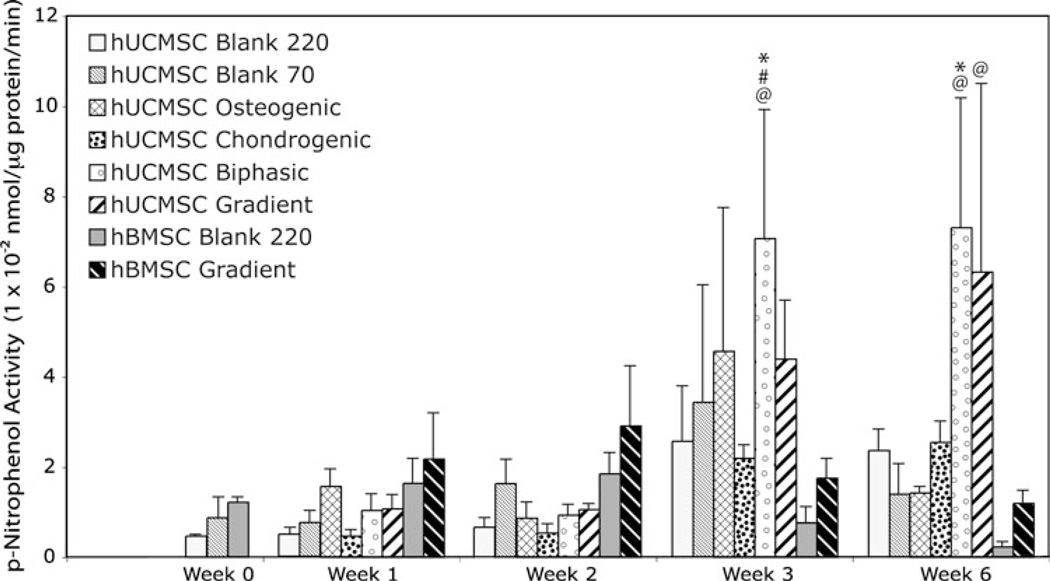
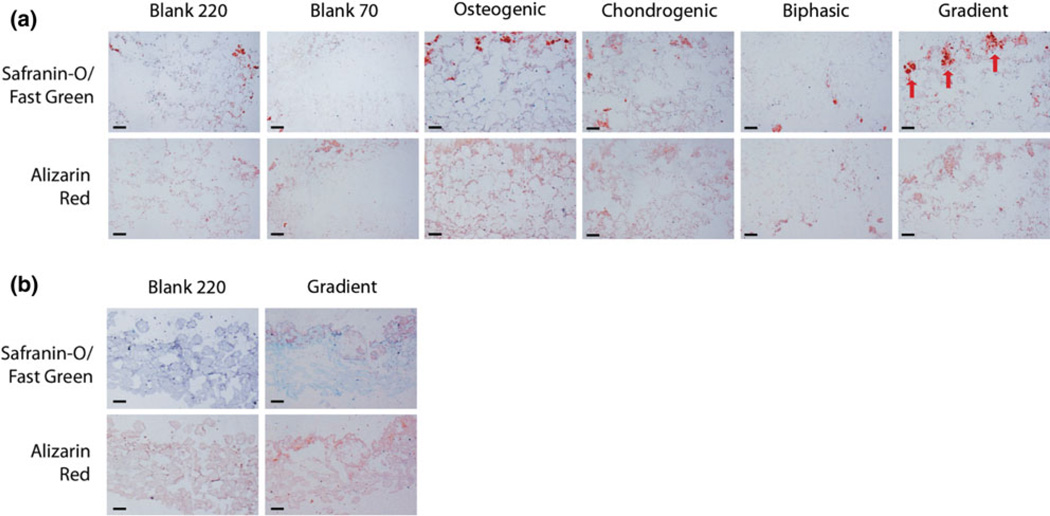
Continuous gradients exist at osteochondral interfaces, which may be engineered by applying spatially patterned gradients of biological cues. In the present study, a protein-loaded microsphere-based scaffold fabrication strategy was applied to achieve spatially and temporally controlled delivery of bioactive signals in three-dimensional (3D) tissue engineering scaffolds. Bone morphogenetic protein-2 and transforming growth factor-beta(1)-loaded poly(D,L-lactic-co-glycolic acid) microspheres were utilized with a gradient scaffold fabrication technology to produce microsphere-based scaffolds containing opposing gradients of these signals. Constructs were then seeded with human bone marrow stromal cells (hBMSCs) or human umbilical cord mesenchymal stromal cells (hUCMSCs), and osteochondral tissue regeneration was assessed in gradient scaffolds and compared to multiple control groups. Following a 6-week cell culture, the gradient scaffolds produced regionalized extracellular matrix, and outperformed the blank control scaffolds in cell number, glycosaminoglycan production, collagen content, alkaline phosphatase activity, and in some instances, gene expression of major osteogenic and chondrogenic markers. These results suggest that engineered signal gradients may be beneficial for osteochondral tissue engineering.
Figures
Similar articles
-
Growth factor gradients via microsphere delivery in biopolymer scaffolds for osteochondral tissue engineering.J Control Release. 2009 Mar 4;134(2):81-90. doi: 10.1016/j.jconrel.2008.10.021. Epub 2008 Nov 17. J Control Release. 2009. PMID: 19071168 Free PMC article.
-
The potential of encapsulating "raw materials" in 3D osteochondral gradient scaffolds.Biotechnol Bioeng. 2014 Apr;111(4):829-41. doi: 10.1002/bit.25145. Epub 2013 Nov 30. Biotechnol Bioeng. 2014. PMID: 24293388 Free PMC article.
-
Cryogenic 3D printing of heterogeneous scaffolds with gradient mechanical strengths and spatial delivery of osteogenic peptide/TGF-β1 for osteochondral tissue regeneration.Biofabrication. 2020 Mar 23;12(2):025030. doi: 10.1088/1758-5090/ab7ab5. Biofabrication. 2020. PMID: 32106097
-
Gradient scaffolds for osteochondral tissue engineering and regeneration.J Mater Chem B. 2020 Sep 23;8(36):8149-8170. doi: 10.1039/d0tb00688b. J Mater Chem B. 2020. PMID: 32776030 Review.
-
Microsphere-Based Scaffolds in Regenerative Engineering.Annu Rev Biomed Eng. 2017 Jun 21;19:135-161. doi: 10.1146/annurev-bioeng-071516-044712. Annu Rev Biomed Eng. 2017. PMID: 28633566 Free PMC article. Review.
Cited by
-
Effect of different sintering methods on bioactivity and release of proteins from PLGA microspheres.Mater Sci Eng C Mater Biol Appl. 2013 Oct;33(7):4343-51. doi: 10.1016/j.msec.2013.06.026. Epub 2013 Jun 28. Mater Sci Eng C Mater Biol Appl. 2013. PMID: 23910352 Free PMC article.
-
From intricate to integrated: Biofabrication of articulating joints.J Orthop Res. 2017 Oct;35(10):2089-2097. doi: 10.1002/jor.23602. Epub 2017 Jun 16. J Orthop Res. 2017. PMID: 28621834 Free PMC article. Review.
-
Spatially organized differentiation of mesenchymal stem cells within biphasic microparticle-incorporated high cell density osteochondral tissues.Adv Healthc Mater. 2015 Oct 28;4(15):2306-13. doi: 10.1002/adhm.201500598. Epub 2015 Sep 15. Adv Healthc Mater. 2015. PMID: 26371790 Free PMC article.
-
Patterning Biomaterials for the Spatiotemporal Delivery of Bioactive Molecules.Front Bioeng Biotechnol. 2016 Jun 2;4:45. doi: 10.3389/fbioe.2016.00045. eCollection 2016. Front Bioeng Biotechnol. 2016. PMID: 27313997 Free PMC article. Review.
-
Concurrent multi-lineage differentiation of mesenchymal stem cells through spatial presentation of growth factors.Biomed Mater. 2020 Aug 31;15(5):055035. doi: 10.1088/1748-605X/ab9bb0. Biomed Mater. 2020. PMID: 32526725 Free PMC article.
References
-
- An Y, Martin K. Humana Press; 2003. Handbook of Histology Methods for Bone and Cartilage.
-
- Baksh D, Yao R, Tuan RS. Comparison of proliferative and multilineage differentiation potential of human mesenchymal stem cells derived from umbilical cord and bone marrow. Stem Cells. 2007;25:1384–1392. - PubMed
-
- Batycky R, Hanes J, Langer R, Edwards D. A theoretical model of erosion and macromolecular drug release from biodegrading microspheres. J. Pharm. Sci. 1997;86:1464–1477. - PubMed
-
- Berkland C, Kim K, Pack DW. Fabrication of PLG microspheres with precisely controlled and monodisperse size distributions. J. Controlled Rel. 2001;73:59–74. - PubMed
-
- Berkland C, Kim K, Pack DW. PLG microsphere size controls drug release rate through several competing factors. Pharm. Res. 2003;20:1055–1062. - PubMed
Publication types
MeSH terms
Grants and funding
LinkOut - more resources
Full Text Sources
Other Literature Sources
