Identification of immobile single molecules using polarization-modulated asynchronous time delay and integration-mode scanning
- PMID: 20380382
- PMCID: PMC4371578
- DOI: 10.1021/ac100302s
Identification of immobile single molecules using polarization-modulated asynchronous time delay and integration-mode scanning
Abstract
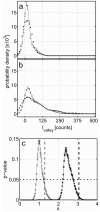
We report the development of a data acquisition method for identifying single molecules on large surfaces with simultaneous characterization of their absorption dipole. The method is based on a previously described device for microarray readout at single molecule sensitivity (Hesse, J.; Sonnleitner, M.; Sonnleitner, A.; Freudenthaler, G.; Jacak, J.; Höglinger, O.; Schindler, H.; Schütz, G. J. Anal. Chem. 2004, 76, 5960-5964). Here, we introduced asynchronous time delay and integration- (TDI-) mode imaging to record also the time course of fluorescence signals: the images thus contain both spatial and temporal information. We demonstrate the principle by modulating the signals via rotating excitation polarization, which allows for discriminating static absorption dipoles against multiple or freely rotating single absorption dipoles. Experiments on BSA carrying different numbers of fluorophores demonstrate the feasibility of the method. Protein species with an average labeling degree of 0.55 and 2.89 fluorophores per protein can be readily distinguished.
Figures


Similar articles
-
[Study on the determination of bovine serum albumin using o-hydroxyphenylfluorone reagent with fluorescence spectrophotometry].Guang Pu Xue Yu Guang Pu Fen Xi. 2008 Jun;28(6):1336-9. Guang Pu Xue Yu Guang Pu Fen Xi. 2008. PMID: 18800717 Chinese.
-
[Study on determination of bovine serum albumin using o-hydroxyphenylfluorone reagent with fluorescence spectrophotometry].Guang Pu Xue Yu Guang Pu Fen Xi. 2008 Aug;28(8):1887-90. Guang Pu Xue Yu Guang Pu Fen Xi. 2008. PMID: 18975826 Chinese.
-
Simultaneous time- and wavelength-resolved fluorescence spectroscopy for near real-time tissue diagnosis.Opt Lett. 2008 Mar 15;33(6):630-2. doi: 10.1364/ol.33.000630. Opt Lett. 2008. PMID: 18347733 Free PMC article.
-
Optically modulated fluorescence bioimaging: visualizing obscured fluorophores in high background.Acc Chem Res. 2014 May 20;47(5):1545-54. doi: 10.1021/ar400325y. Epub 2014 Apr 14. Acc Chem Res. 2014. PMID: 24725021 Free PMC article. Review.
-
Choosing the Probe for Single-Molecule Fluorescence Microscopy.Int J Mol Sci. 2022 Nov 29;23(23):14949. doi: 10.3390/ijms232314949. Int J Mol Sci. 2022. PMID: 36499276 Free PMC article. Review.
Cited by
-
Single Molecule Fluorescence Microscopy and Machine Learning for Rhesus D Antigen Classification.Sci Rep. 2016 Sep 1;6:32317. doi: 10.1038/srep32317. Sci Rep. 2016. PMID: 27580632 Free PMC article.
-
Streptavidin functionalized polymer nanodots fabricated by visible light lithography.J Nanobiotechnology. 2015 Mar 28;13:27. doi: 10.1186/s12951-015-0084-6. J Nanobiotechnology. 2015. PMID: 25888763 Free PMC article.
References
-
- Hesse Jan, Sonnleitner Max, Sonnleitner Alois, Freudenthaler Günter, Jacak Jaroslaw, Höglinger Otmar, Schindler Hansgeorg, Schütz Gerhard J. Single-molecule reader for high-throughput bioanalysis. Anal Chem. 2004 Oct;76(19):5960–5964. - PubMed
-
- Hesse Jan, Haselgrübler Thomas, Wechselberger Christian, Schütz Gerhard J. Single Molecule Biology. Academic Press; 2008. p. 289. chapter Single Molecule Microarray Analysis.
-
- Heller Michael J. DNA microarray technology: devices, systems, and applications. Annu Rev Biomed Eng. 2002;4:129–153. - PubMed
-
- Angenendt Philipp, Kreutzberger J, Jörn Glökler, Hoheisel Jörg D. Generation of high density protein microarrays by cell-free in situ expression of unpurified PCR products. Mol Cell Proteomics. 2006 Sep;5(9):1658–1666. - PubMed
Publication types
MeSH terms
Substances
Grants and funding
LinkOut - more resources
Full Text Sources

