

Artificial neural networks for the prediction of peptide drift time in ion mobility mass spectrometry
- PMID: 20380738
- PMCID: PMC2874804
- DOI: 10.1186/1471-2105-11-182
Artificial neural networks for the prediction of peptide drift time in ion mobility mass spectrometry
Abstract
Background: There is an increasing usage of ion mobility-mass spectrometry (IMMS) in proteomics. IMMS combines the features of ion mobility spectrometry (IMS) and mass spectrometry (MS). It separates and detects peptide ions on a millisecond time-scale. IMS separates peptide ions based on drift time that is determined by the collision cross-section of each peptide ion in a given experiment condition. A peptide ion's collision cross-section is related to the ion size and shape resulted from the peptide amino acid sequence and their modifications. This inherent relation between the drift time of peptide ion and peptide sequence indicates that the drift time of peptide ions can be used to infer peptide sequence and therefore, for peptide identification.
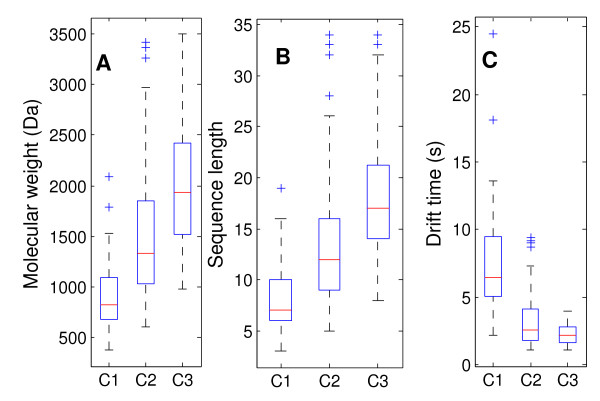
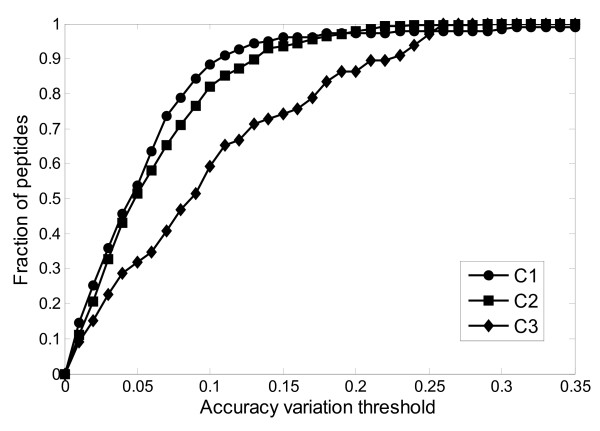
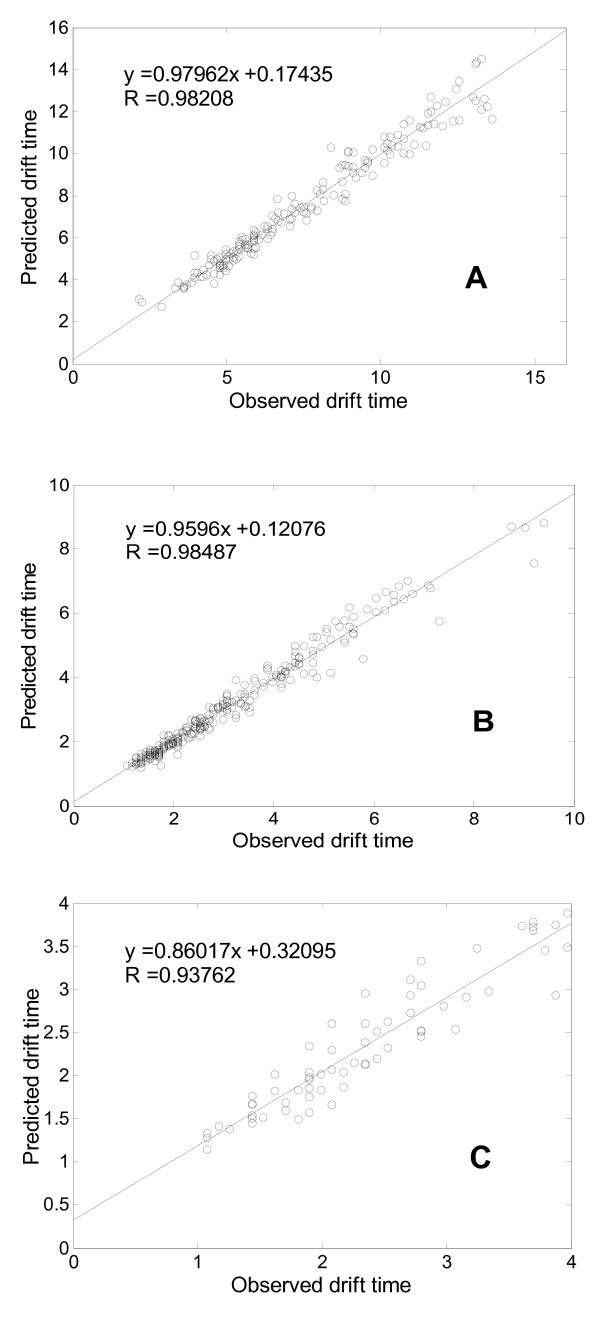
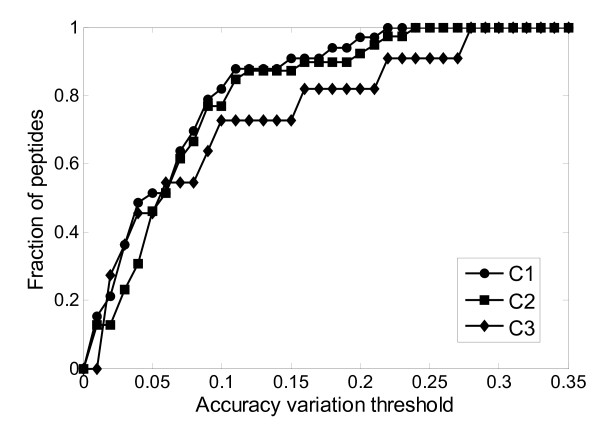
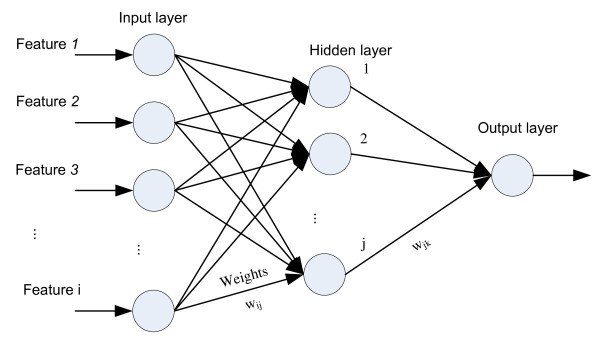
Results: This paper describes an artificial neural networks (ANNs) regression model for the prediction of peptide ion drift time in IMMS. Each peptide in this work was represented using three descriptors (i.e., molecular weight, sequence length and a two-dimensional sequence index). An ANN predictor consisting of four input nodes, three hidden nodes and one output node was constructed for peptide ion drift time prediction. For the model training and testing, a 10-fold cross-validation strategy was employed for three datasets each containing different charge states. Dataset one contains 212 singly-charged peptide ions, dataset two has 306 doubly-charged peptide ions, and dataset three has 77 triply-charged peptide ions. Our proposed method achieved 94.4%, 93.6% and 74.2% prediction accuracy for singly-, doubly- and triply-charged peptide ions, respectively.
Conclusions: An ANN-based method has been developed for predicting the drift time of peptide ions in IMMS. The results achieved here demonstrate the effectiveness and efficiency of the prediction model. This work can enhance the confidence of protein identification by combining with current database search approaches for protein identification.
Figures
References
Publication types
MeSH terms
Substances
Grants and funding
LinkOut - more resources
Full Text Sources
