

Comparison of analyses of the QTLMAS XIII common dataset. I: genomic selection
- PMID: 20380752
- PMCID: PMC2857840
- DOI: 10.1186/1753-6561-4-s1-s1
Comparison of analyses of the QTLMAS XIII common dataset. I: genomic selection
Abstract
Background: Genomic selection, the use of markers across the whole genome, receives increasing amounts of attention and is having more and more impact on breeding programs. Development of statistical and computational methods to estimate breeding values based on markers is a very active area of research. A simulated dataset was analyzed by participants of the QTLMAS XIII workshop, allowing a comparison of the ability of different methods to estimate genomic breeding values.
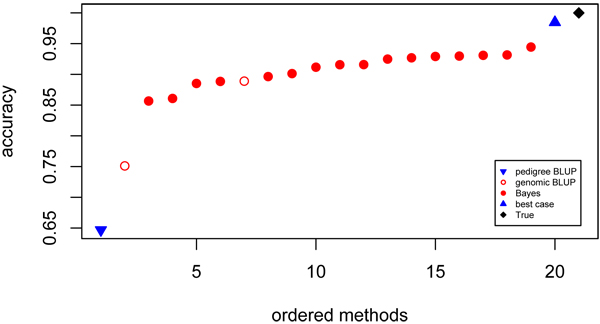
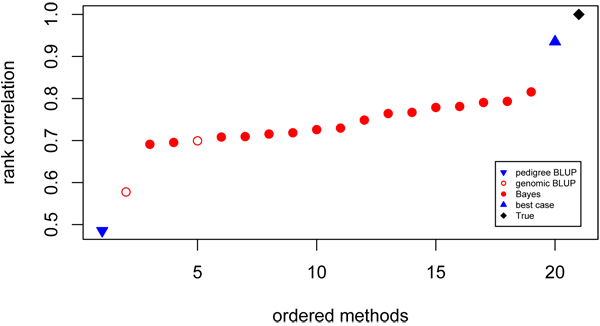
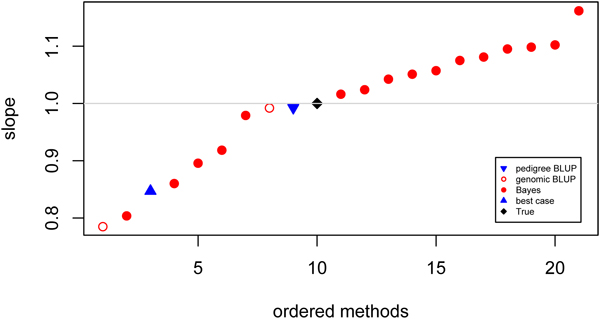
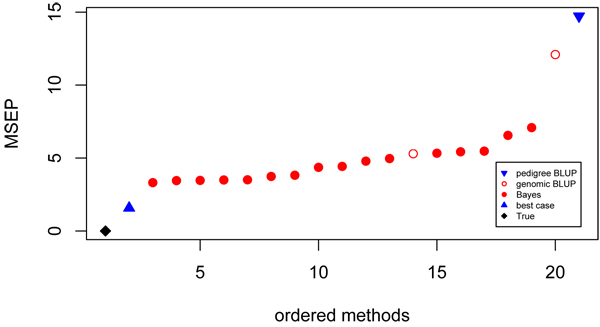
Methods: A best case scenario was analyzed by the organizers where QTL genotypes were known. Participants submitted estimated breeding values for 1000 unphenotyped individuals together with a description of the applied method(s). The submitted breeding values were evaluated for correlation with the simulated values (accuracy), rank correlation of the best 10% of individuals and error in predictions. Bias was tested by regression of simulated on estimated breeding values.
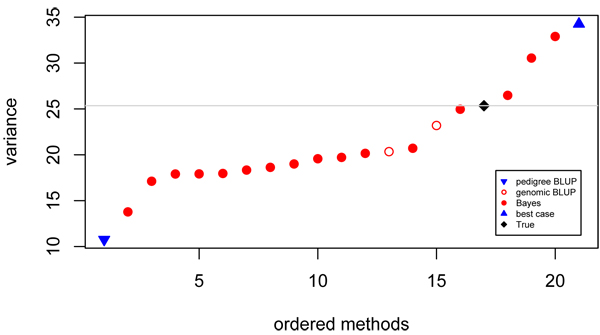
Results: The accuracy obtained from the best case scenario was 0.94. Six research groups submitted 19 sets of estimated breeding values. Methods that assumed the same variance for markers showed accuracies, measured as correlations between estimated and simulated values, ranging from 0.75 to 0.89 and rank correlations between 0.58 and 0.70. Methods that allowed different marker variances showed accuracies ranging from 0.86 to 0.94 and rank correlations between 0.69 and 0.82. Methods assuming equal marker variances were generally more biased and showed larger prediction errors.
Conclusions: The best performing methods achieved very high accuracies, close to accuracies achieved in a best case scenario where QTL genotypes were known without error. Methods that allowed different marker variances generally outperformed methods that assumed equal marker variances. Genomic selection methods performed well compared to traditional, pedigree only, methods; all methods showed higher accuracies than those obtained for breeding values estimated solely on pedigree relationships.
Figures
References
-
- Dekkers JCM. Commercial application of marker- and gene-assisted selection in livestock: Strategies and lessons. Anim. 2004;82:E313–E328. - PubMed
LinkOut - more resources
Full Text Sources
