. 2010 Jul;44(3):272-81.
doi: 10.1016/j.mcn.2010.03.013. Epub 2010 Apr 7.

Adhesion to the extracellular matrix is required for interleukin-1 beta actions leading to reactive phenotype in rat astrocytes

Affiliations

Adhesion to the extracellular matrix is required for interleukin-1 beta actions leading to reactive phenotype in rat astrocytes

Lauren Summers et al. Mol Cell Neurosci. 2010 Jul.

Abstract

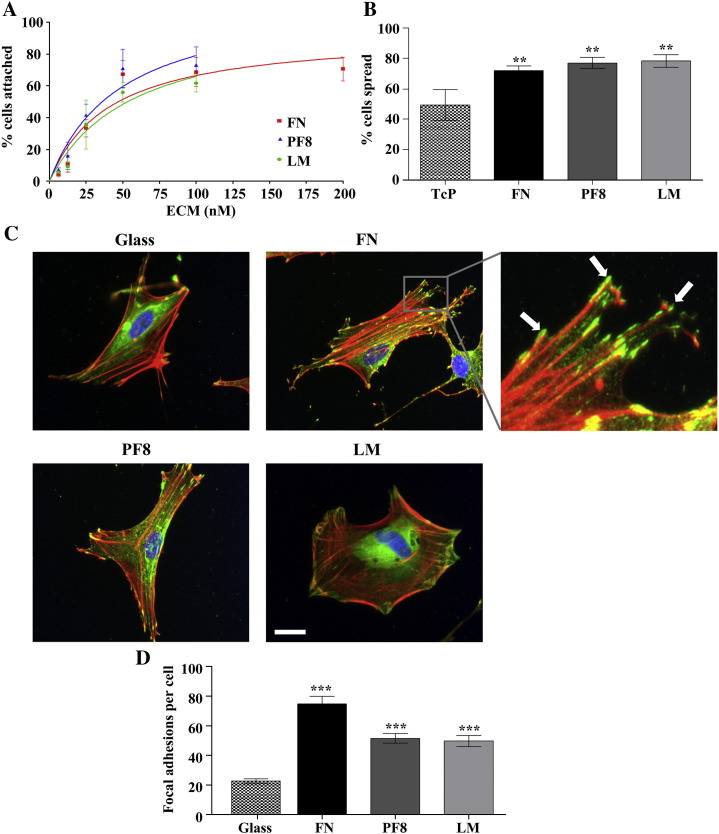
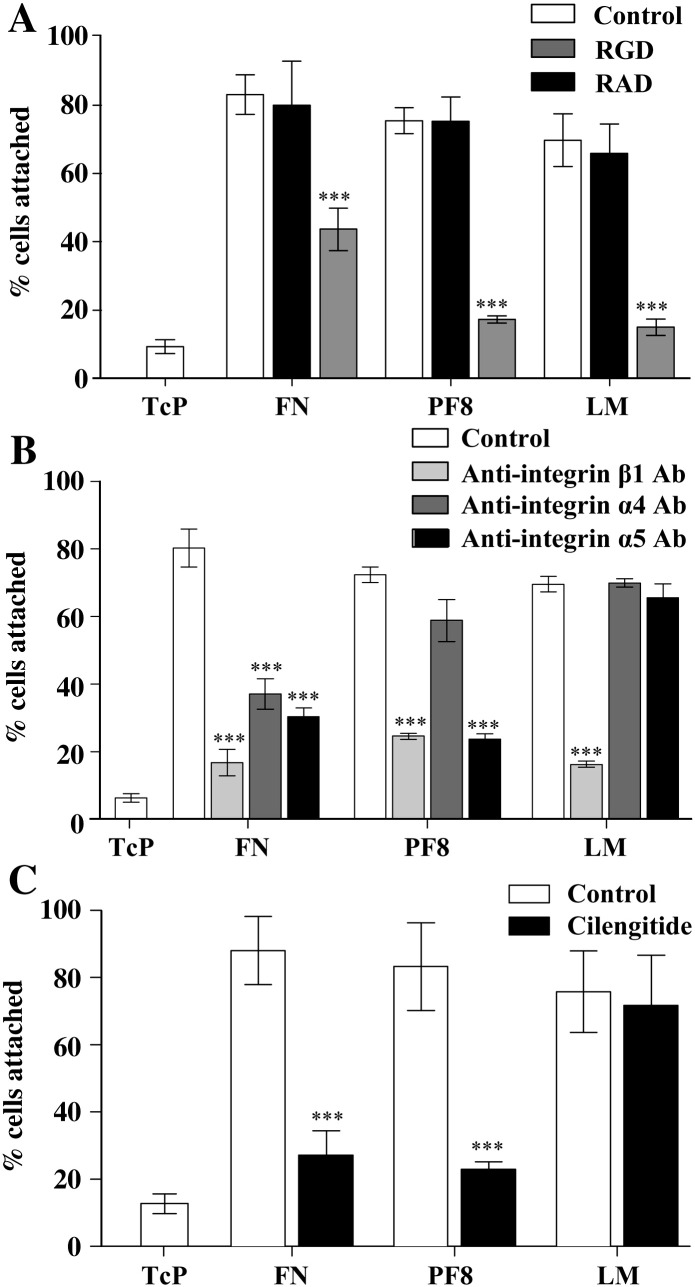
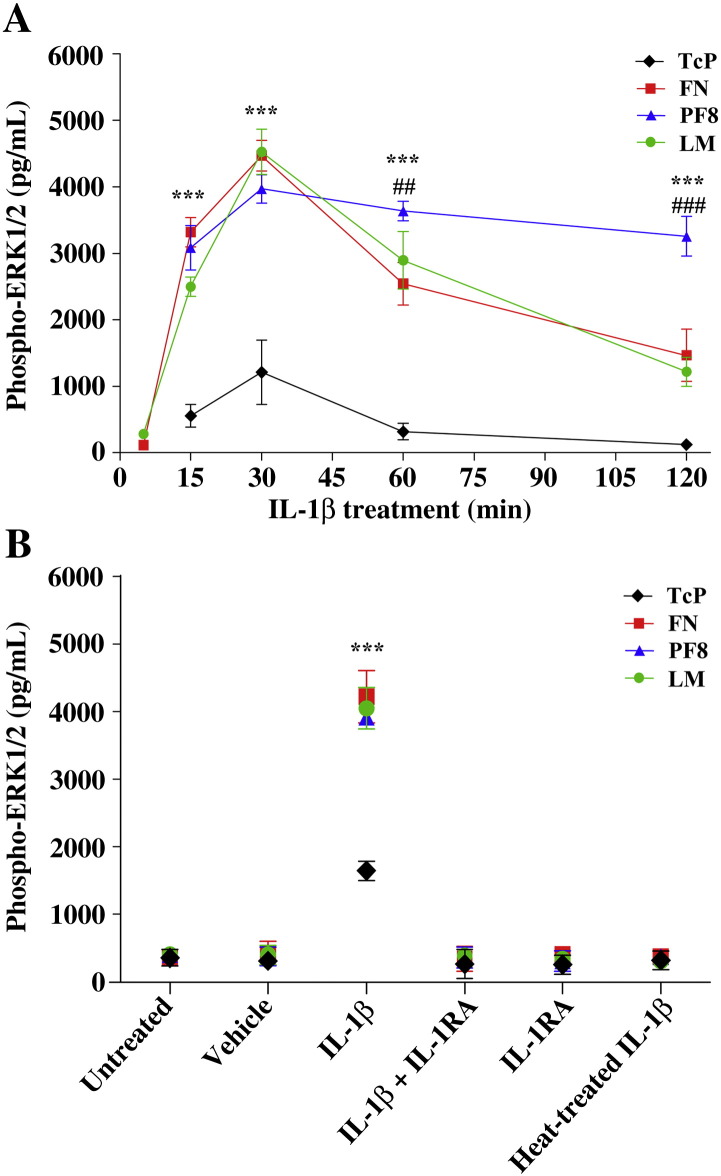
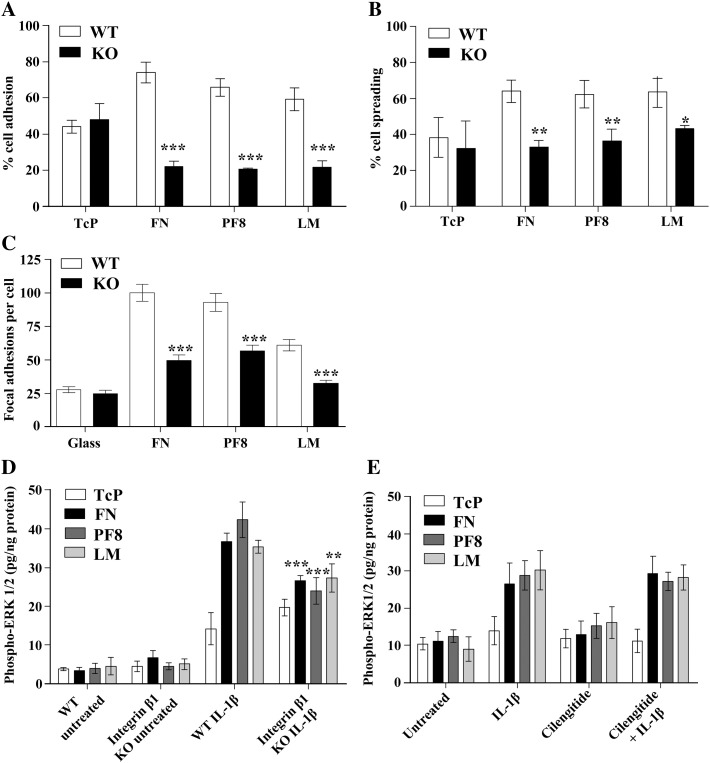
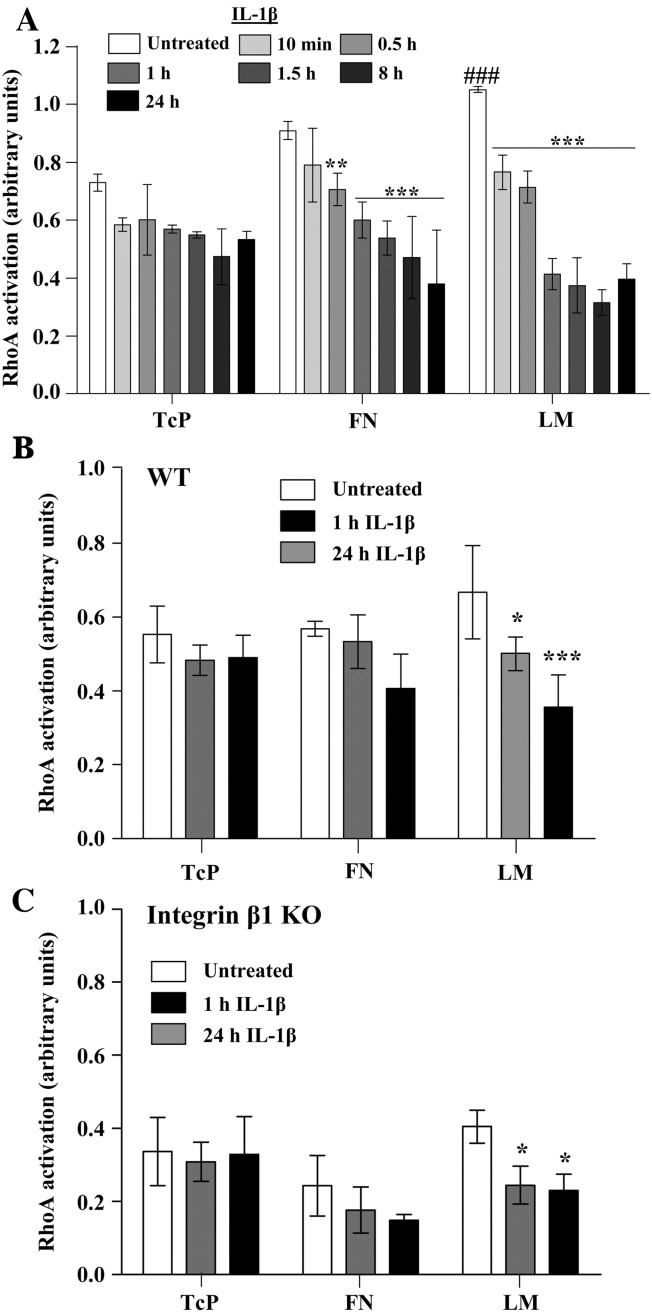
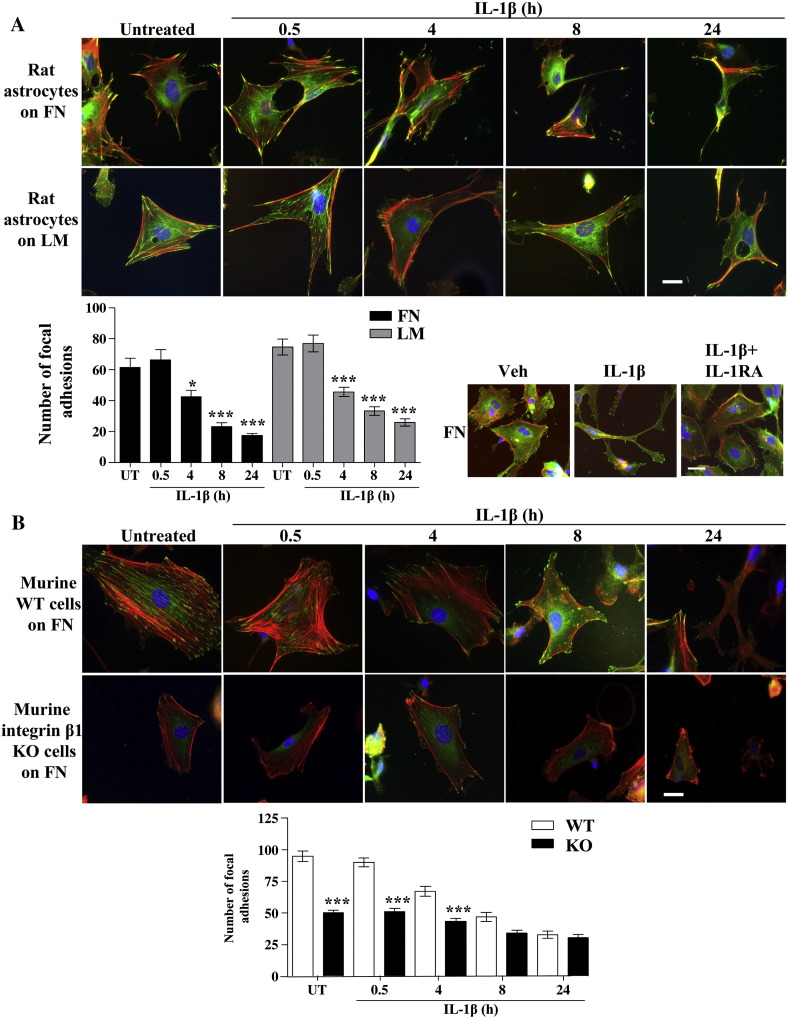
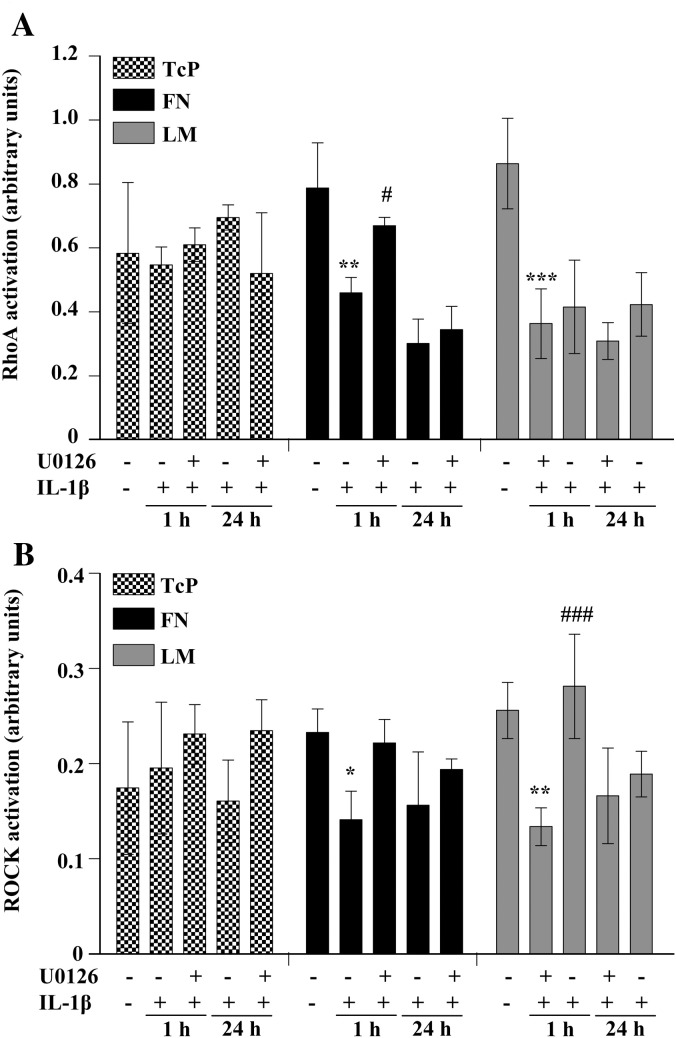
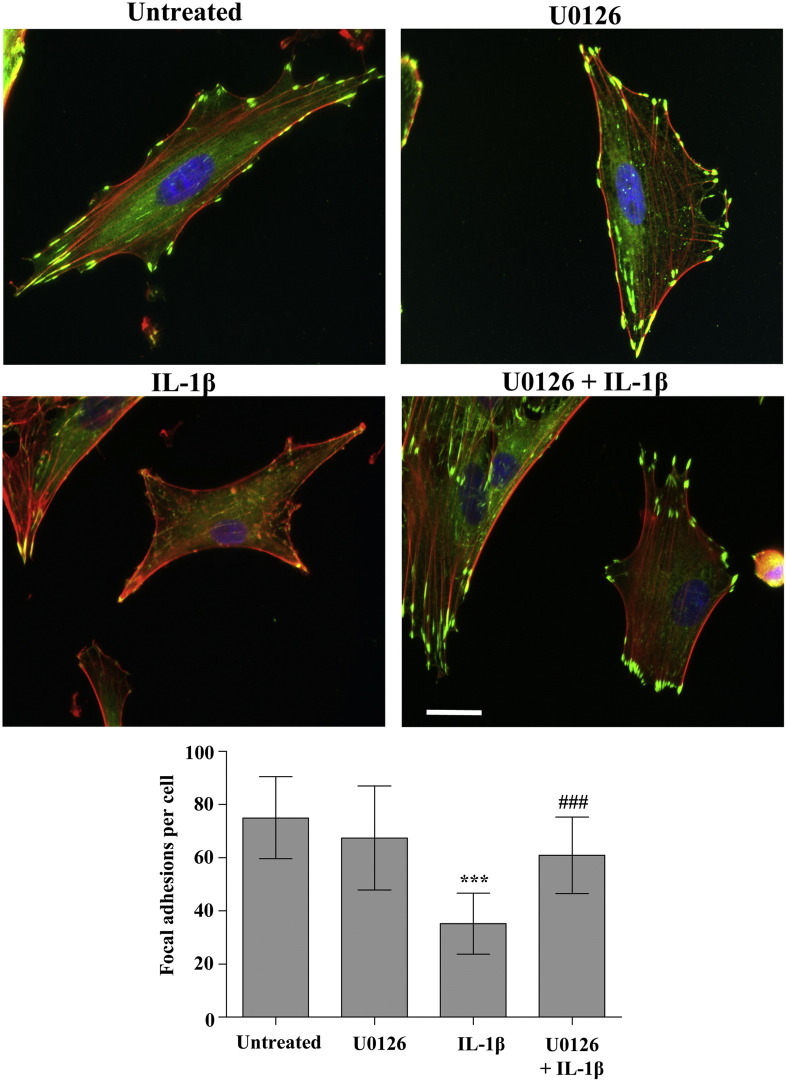
The extracellular matrix (ECM) of the brain is essential for homeostasis and normal functions, but is rapidly remodelled during acute brain injury alongside the development of an inflammatory response driven by the cytokine interleukin (IL)-1. Whether the ECM regulates IL-1 actions in astrocytes is completely unknown. The aim of this study was to test the hypothesis that cellular attachment to the ECM is a critical mediator of IL-1beta-induced signalling pathways and development of reactive phenotype in astrocytes. Primary rat astrocytes adhered to fibronectin, laminin and fibrillin-1 in an integrin-dependent manner. Attachment to these ECM molecules significantly increased IL-1beta-induced activation of extracellular signal-regulated kinase 1/2 (ERK1/2) and inhibition of RhoA and Rho kinase (ROCK), coincident with loss of focal adhesions and cellular morphological changes. Our data demonstrate that the ECM regulates IL-1 actions in astrocytes via cross-talk mechanisms between ERK1/2 and RhoA/ROCK, which could have important implications in brain inflammatory disorders.


Figures

Fig. 1
Fig. 1
Astrocytes attached, spread and formed focal adhesions on ECM molecules. A. Astrocytes were seeded into wells pre-coated with varying concentrations of fibronectin (FN), FBN1 fragment (PF8) or laminin 111 (LM) for 30 min, and maximal astrocyte attachment occurred at approximately 100 nM with a curve fitted by non-linear fit. B. Cell spreading was assessed by quantification of phase contrast images, where spread cells were elongated and phase dark. Astrocytes were significantly more spread after 150 min in wells pre-coated with 100 nM FN, PF8 and LM compared to TcP. C. Cells were seeded onto ECM-coated coverslips and left overnight before staining with an antibody against vinculin (green), phalloidin to detect actin stress fibers (red) and DAPI nuclear staining (blue). Astrocytes had a more extended morphology and formed significantly more focal adhesions (indicated by white arrows) on coverslips coated with FN, PF8 and LM compared to bare glass. Scale bars represent 20 μm. Data were analysed using one-way ANOVA with Tukey post-hoc tests to compare all data sets where P < 0.01 ** and P < 0.001 ***. Data are the mean ± SD and images are typical of three independent experiments.
Fig. 2
Fig. 2
Astrocyte attachment to ECM was RGD and integrin-dependent. A. Astrocytes were pre-treated with RGD peptide or RAD control peptide (10 μg/mL, 30 min) and then seeded into ECM-coated wells for 30 min. The RGD peptide significantly inhibited adhesion to FN, PF8 and LM compared to the RAD control peptide. B. Similarly, astrocyte adhesion to FN, PF8 and LM was significantly inhibited by pre-treatment with anti-integrin antibodies (10 μg/mL, 30 min). C. Pre-treatment of astrocytes with the αv integrin inhibitor, cilengitide (10 μM, 30 min), significantly inhibited adhesion to FN and PF8. Data were analysed by two-way ANOVA with Bonferroni post-hoc tests to compare treated cells with untreated control cells, where P < 0.001 ***. Data presented are the mean ± SD of three independent experiments.
Fig. 3
Fig. 3
Attachment to ECM enhanced IL-1β-induced ERK1/2 activation. A. Astrocytes were treated with IL-1β (10 ng/mL) over a time course of 120 min, and ERK1/2 activation was assessed by ELISA. Astrocytes showed significantly increased IL-1β-induced ERK1/2 activation when attached to FN, PF8 and LM compared to TcP where P < 0.001 ***. ERK1/2 activation was significantly sustained on PF8 following 60 min IL-1β treatment compared to FN, where P < 0.01 ##, and on PF8 following IL-1β treatment for 120 min compared to FN and LM, where P < 0.001 ###. B. Control experiments showed that untreated cells had very low levels of ERK1/2 activation, the vehicle used to dilute IL-1β did not induce ERK1/2 activation and that IL-1β-induced ERK1/2 activation was inhibited by IL-1RA (10 μg/mL). Again, cells on FN, PF8 and LM had significantly higher IL-1β-induced ERK1/2 activation than cells on TcP where P < 0.001 ***. Data were analysed by two-way ANOVA with Bonferroni post-hoc tests to compare all data sets. Data presented are the mean ± SD of three independent experiments.
Fig. 4
Fig. 4
Integrin β1 mediated glial attachment and spreading on ECM, and ECM effects on IL-1β-induced ERK1/2 activation. Integrin β1 knockout (KO) glial cells showed significantly less adhesion (A) and spreading (B) than wild-type (WT) cells using a two-way ANOVA with Bonferroni post-hoc tests to compare all data where P < 0.001 ***, P < 0.01 ** and P < 0.05 *. C. Integrin β1 KO cells had significantly fewer focal adhesions on FN, PF8 and LM than WT cells, according to a one-way ANOVA with Tukey post-hoc tests where P < 0.001 ***. D. Integrin β1 KO cells had significantly less ERK1/2 activation, following IL-1β treatment (10 ng/mL, 30 min), compared to WT cells on FN, PF8 and LM, where P < 0.001 *** and P < 0.05 **, according to a two-way ANOVA with Bonferroni post-hoc tests to compare all values. E. However, pre-treatment with the αv integrin inhibitor, cilengitide (10 μM, 30 min), did not significantly affect ERK1/2 activation following IL-1β treatment (10 ng/mL, 30 min) compared to cells treated with IL-1β alone. Levels of phosphorylated ERK1/2 in D and E have been corrected by protein assay (expressed as pg/ng proteins) to correct for differences in cell numbers between WT and KO cultures. Data presented are the mean ± SD of three independent experiments.
Fig. 5
Fig. 5
IL-1β-induced RhoA deactivation was ECM dependent. A. Rat astrocytes were treated with IL-1β (10 ng/mL from 10 min to 24 h) and RhoA activation was assessed by ELISA. IL-1β significantly inhibited RhoA activation compared to untreated cells on FN and LM, but not on TcP, where P < 0.01 ** and P < 0.001 ***. Cells attached to LM had significantly higher RhoA activation than cells on TcP, where P < 0.001 ###. B. Similarly, in WT murine cells, activation of RhoA was significantly inhibited by IL-1β treatment (10 ng/mL for 1 or 24 h) compared to untreated cells attached to LM, where P < 0.05 * and P < 0.001 ***. C. Integrin β1 KO murine cells had lower levels of RhoA activation compared to WT cells, but IL-1β treatment (10 ng/mL for 1 h or 24 h) significantly reduced RhoA activation further on LM compared to untreated cells, where P < 0.05 *. All data were analysed by two-way ANOVA with Bonferroni post-hoc tests. Data presented are the mean ± SD of three independent experiments.
Fig. 6
Fig. 6
IL-1β treatment induced loss of focal adhesions when cells were attached to ECM. A. Rat astrocytes were treated with IL-1β (10 ng/mL), in the absence or the presence of IL-1RA (10 μg/mL), over a time course of 24 h, and stained with an antibody against vinculin (green), phalloidin to detect actin stress fibers (red) and DAPI nuclear staining (blue). Focal adhesions were quantified using Image J software, and IL-1β treated cells showed a significant reduction in the number of focal adhesions compared to untreated cells when attached to FN or LM, according to one-way ANOVAs with Tukey post-hoc tests to compare all data where P < 0.05 * and P < 0.001 ***. B. Integrin β1 KO cells showed significantly fewer focal adhesions than WT cells when untreated or treated with IL-1β (10 ng/mL, for 0.5 h or 4 h), using a two-way ANOVA with Bonferroni post-hoc tests to compare all data sets, where P < 0.001 ***. Scale bars represent 20 μm and images are representative of three independent experiments. Data presented are the mean ± SD of three independent experiments.
Fig. 7
Fig. 7
MEK inhibition partially prevented IL-1β-induced RhoA/ROCK inhibition. A. Astrocytes were treated with IL-1β (10 ng/mL, 1 h) and RhoA activation was assessed by ELISA. IL-1β treatment significantly inhibited RhoA activation compared to untreated cells attached to FN and LM, where P < 0.01 ** and P < 0.001 ***. Astrocytes on FN had significantly higher RhoA activation when treated with the MEK inhibitor, U0126 (20 μM, 30 min), prior to IL-1β treatment compared to cells treated with IL-1β alone, where P < 0.05 #. B. ROCK activation was also assessed by ELISA. IL-1β treatment (10 ng/mL, 1 h) significantly inhibited ROCK activation when cells were attached to FN or LM, where P < 0.05 * and P < 0.01 **. ROCK activation was significantly higher when cells were pre-treated with U0126 (20 μM, 30 min) before IL-1β treatment, on LM where P < 0.001 ### compared to cells treated with IL-1β alone. Data were analysed by two-way ANOVA with Bonferroni post-hoc tests to compare all data. Data presented are the mean ± SD of three independent experiments.
Fig. 8
Fig. 8
MEK inhibition prevented IL-1β-induced loss of focal adhesions. Astrocytes were pre-treated with U0126 (20 μM, 30 min), and/or treated with IL-1β (10 ng/mL, 24 h), then stained with an antibody against vinculin (green), phalloidin to detect actin stress fibers (red) and DAPI nuclear staining (blue). Astrocytes treated with IL-1β had significantly fewer focal adhesions than untreated cells seeded onto FN where P < 0.001 ***. Yet cells pre-treated with U0126 and then treated with IL-1β had significantly more focal adhesions than cells treated with IL-1β alone where P < 0.001 ###, using a one-way ANOVA with Tukey post-hoc tests to compare all data sets. Data presented are the mean ± SD of three independent experiments. Scale bars represent 20 μm and images are representative of three independent experiments.

Similar articles

Cited by

References

    1. Bellail A.C., Hunter S.B., Brat D.J., Tan C., Van Meir E.G. Microregional extracellular matrix heterogeneity in brain modulates glioma cell invasion. Int. J. Biochem. Cell Biol. 2004;36:1046–1069. - PubMed
    1. Brozzi F., Arcuri C., Giambanco I., Donato R. S100B protein regulates astrocyte shape and migration via interaction with Src kinase: implications for astrocyte development, activation and tumour growth. J. Biol. Chem. 2009;284:8797–8811. - PMC - PubMed
    1. Cain S.A., Baldock C., Gallagher J., Morgan A., Bax D.V., Weiss A.S., Shuttleworth C.A., Kielty C.M. Fibrillin-1 interactions with heparin: implications for microfibril and elastic fiber assembly. J. Biol. Chem. 2005;280:30526–30537. - PubMed
    1. Fukuda S., Fini C.A., Mabuchi T., Koziol J.A., Eggleston L.L., del Zoppo G.J. Focal cerebral ischemia induces active proteases that degrade microvascular matrix. Stroke. 2004;35:998–1004. - PMC - PubMed
    1. Giulian D., Baker T.J., Shih L.C., Lachman L.B. Interleukin 1 of the central nervous system is produced by ameboid microglia. J. Exp. Med. 1986;164:594–604. - PMC - PubMed

Publication types

MeSH terms