

Age-related declines in car following performance under simulated fog conditions
- PMID: 20380908
- PMCID: PMC2881661
- DOI: 10.1016/j.aap.2009.04.023
Age-related declines in car following performance under simulated fog conditions
Abstract
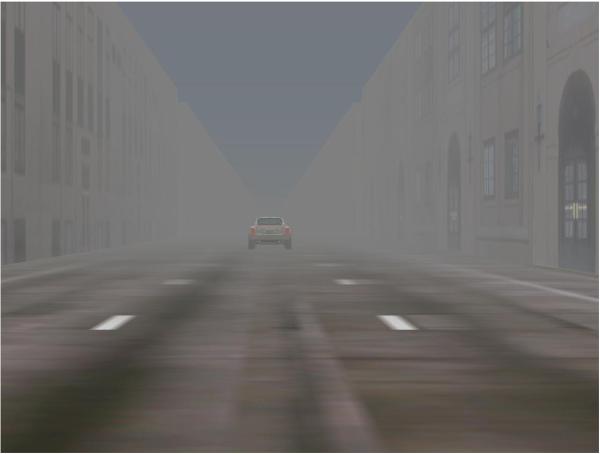
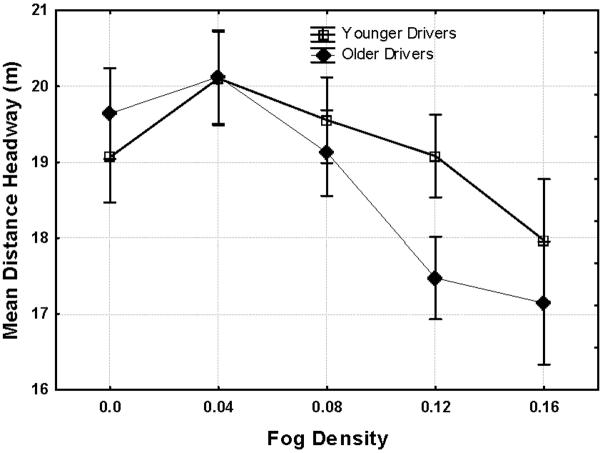
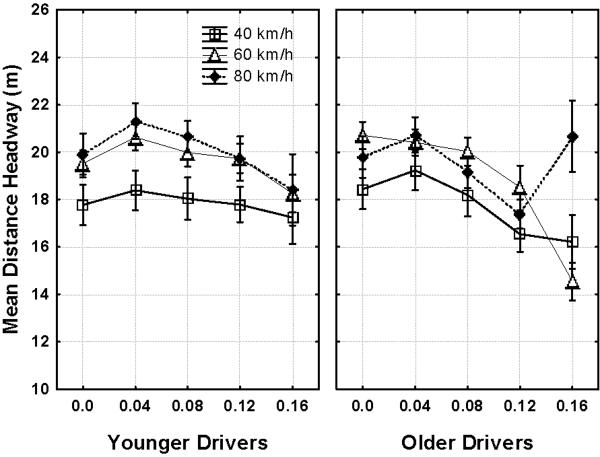
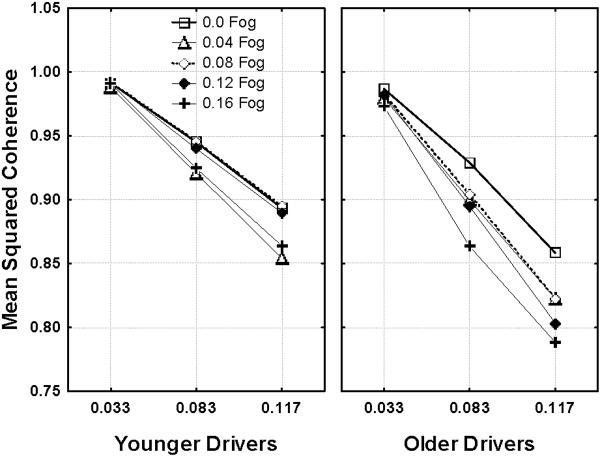
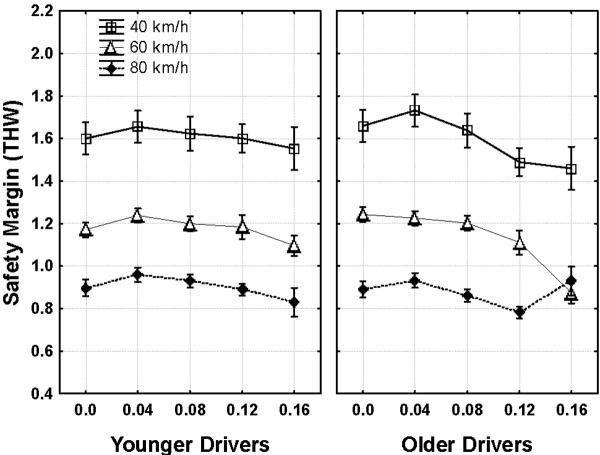
The present study examined age-related differences in car following performance when contrast of the driving scene was reduced by simulated fog. Older (mean age of 72.6) and younger (mean age of 21.1) drivers were presented with a car following scenario in a simulator in which a lead vehicle (LV) varied speed according to a sum of three sine wave functions. Drivers were shown an initial following distance of 18 m and were asked to maintain headway distance by controlling speed to match changes in LV speed. Five simulated fog conditions were examined ranging from a no fog condition (contrast of 0.55) to a high fog condition (contrast of 0.03). Average LV speed varied across trials (40, 60, or 80 km/h). The results indicated age-related declines in car following performance for both headway distance and RMS (root mean square) error in matching speed. The greatest decline occurred at moderate speeds under the highest fog density condition, with older drivers maintaining a headway distance that was 21% closer than younger drivers. At higher speeds older drivers maintained a greater headway distance than younger drivers. These results suggest that older drivers may be at greater risk for a collision under high fog density and moderate speeds.
Copyright (c) 2009 Elsevier Ltd. All rights reserved.
Figures
Similar articles
-
Speed choice and driving performance in simulated foggy conditions.Accid Anal Prev. 2011 May;43(3):698-705. doi: 10.1016/j.aap.2010.10.014. Epub 2010 Dec 15. Accid Anal Prev. 2011. PMID: 21376857
-
Aging and the detection of imminent collisions under simulated fog conditions.Accid Anal Prev. 2012 Nov;49:525-31. doi: 10.1016/j.aap.2012.03.029. Epub 2012 Apr 10. Accid Anal Prev. 2012. PMID: 23036430 Free PMC article.
-
Why do drivers maintain short headways in fog? A driving-simulator study evaluating feeling of risk and lateral control during automated and manual car following.Ergonomics. 2012;55(9):971-85. doi: 10.1080/00140139.2012.691993. Epub 2012 Jul 17. Ergonomics. 2012. PMID: 22804738
-
Effects of peripheral transverse line markings on drivers' speed and headway choice and crash risk in car-following: A naturalistic observation study.Accid Anal Prev. 2020 Oct;146:105701. doi: 10.1016/j.aap.2020.105701. Epub 2020 Aug 18. Accid Anal Prev. 2020. PMID: 32823033
-
Car following decisions under three visibility conditions and two speeds tested with a driving simulator.Accid Anal Prev. 2007 Jan;39(1):106-16. doi: 10.1016/j.aap.2006.06.009. Epub 2006 Sep 7. Accid Anal Prev. 2007. PMID: 16962059
Cited by
-
Cognition and driving ability in isolated and symptomatic REM sleep behavior disorder.Sleep. 2022 Apr 11;45(4):zsab253. doi: 10.1093/sleep/zsab253. Sleep. 2022. PMID: 34958375 Free PMC article.
-
Measuring listening effort: driving simulator versus simple dual-task paradigm.Ear Hear. 2014 Nov-Dec;35(6):623-32. doi: 10.1097/AUD.0000000000000079. Ear Hear. 2014. PMID: 25083599 Free PMC article.
-
The architecture of functional brain network modulated by driving during adverse weather conditions.Cogn Neurodyn. 2023 Apr;17(2):547-553. doi: 10.1007/s11571-022-09825-y. Epub 2022 Jun 28. Cogn Neurodyn. 2023. PMID: 37007207 Free PMC article.
-
Visual Acuity does not Moderate Effect Sizes of Higher-Level Cognitive Tasks.Exp Aging Res. 2016;42(3):221-63. doi: 10.1080/0361073X.2016.1156964. Exp Aging Res. 2016. PMID: 27070044 Free PMC article.
-
Estimating time-to-contact when vision is impaired.Sci Rep. 2021 Oct 27;11(1):21213. doi: 10.1038/s41598-021-00331-5. Sci Rep. 2021. PMID: 34707116 Free PMC article.
References
-
- Andersen GJ, Atchley P. Age-related differences in the detection of three-dimensional surfaces from optic flow. Psychology and Aging. 1995;10:650–658. - PubMed
-
- Andersen GJ, Braunstein ML. The perception of depth and slant from texture in 3D scenes. Perception. 1998;27:1087–1106. - PubMed
-
- Andersen GJ, Cisneros J, Atchley P, Saidpour A. Speed, size, and edge-rate information for the detection of collision events. Journal of Experimental Psychology. Human Perception and Performance. 1999;25:256–269. - PubMed
-
- Andersen GJ, Enriquez A. Aging and the detection of observer and moving object collisions. Psychology and Aging. 2006;21:74–85. - PubMed
-
- Andersen GJ, Sauer CW. Optical information for collision detection during deceleration. In: Hecht H, Kaiser M, editors. Theories of time to contact, Advances in Psychology Series, North Holland. Elsevier; Amsterdam Netherlands: 2004. pp. 93–108.
Publication types
MeSH terms
Grants and funding
LinkOut - more resources
Full Text Sources
