Comparative Study
. 2010 Jul-Aug;43(4):318-25.
doi: 10.1016/j.jelectrocard.2010.02.011. Epub 2010 Apr 8.

The Selvester QRS Score is more accurate than Q waves and fragmented QRS complexes using the Mason-Likar configuration in estimating infarct volume in patients with ischemic cardiomyopathy

Affiliations
Comparative Study

The Selvester QRS Score is more accurate than Q waves and fragmented QRS complexes using the Mason-Likar configuration in estimating infarct volume in patients with ischemic cardiomyopathy

Mary G Carey et al. J Electrocardiol. 2010 Jul-Aug.

Abstract

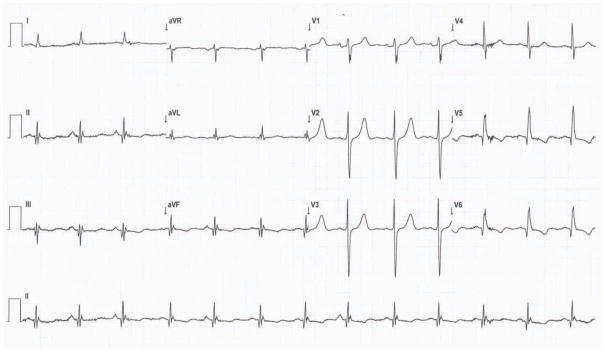
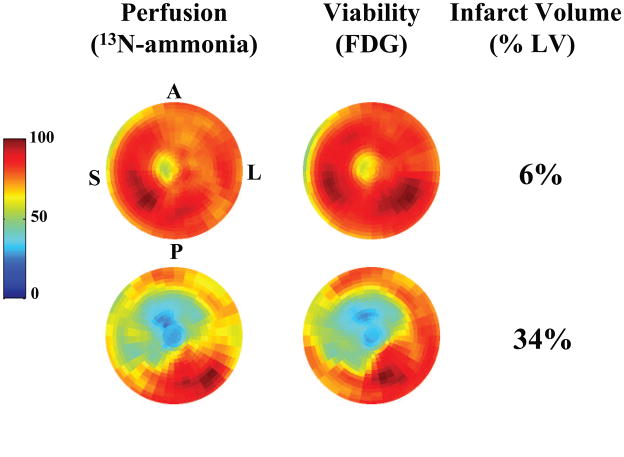
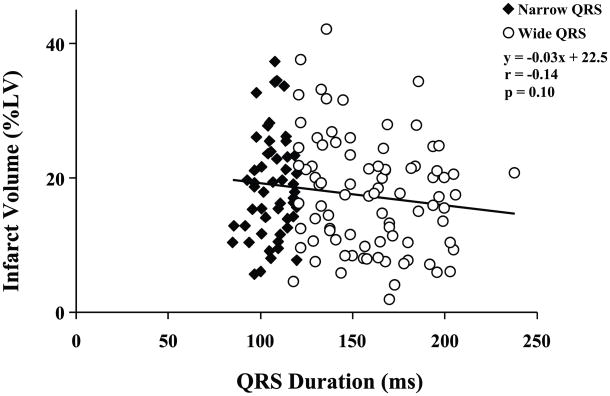
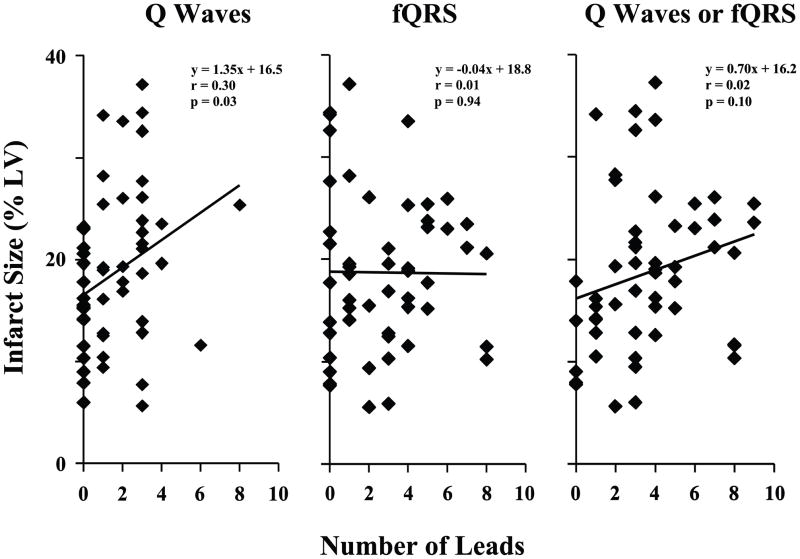
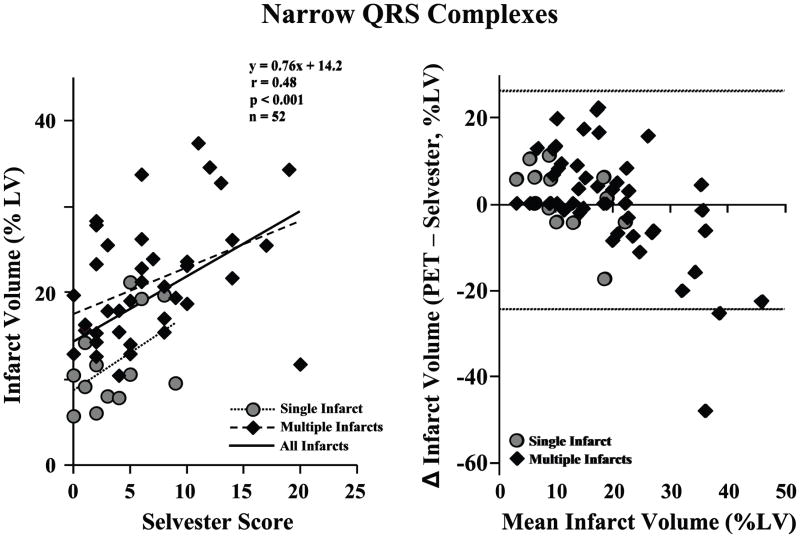
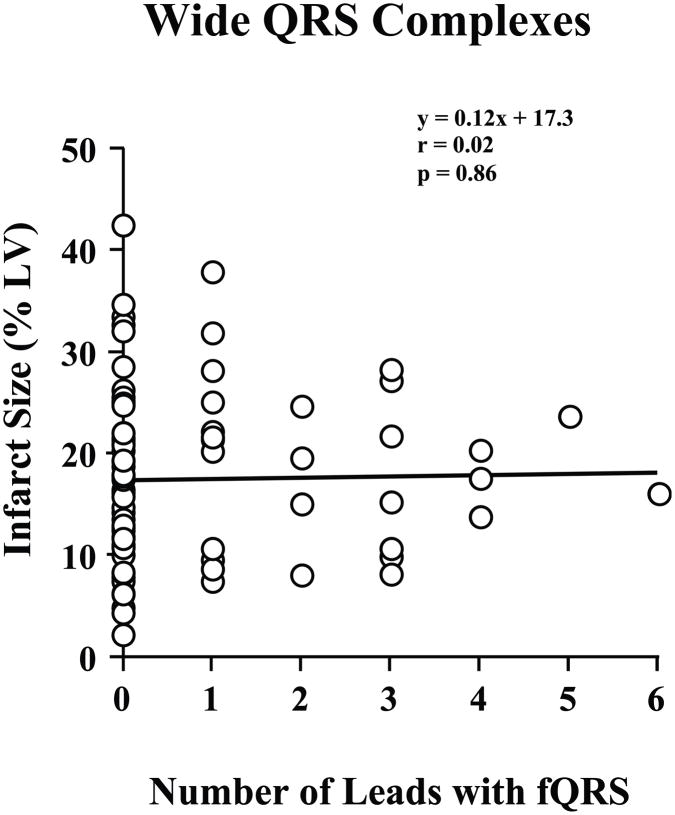
Infarct volume independently predicts cardiovascular events. Fragmented QRS complexes (fQRS) may complement Q waves for identifying infarction; however, their utility in advanced coronary disease is unknown. We tested whether fQRS could improve the electrocardiographic prediction of infarct volume by positron emission tomography in 138 patients with ischemic cardiomyopathy (ejection fraction, 0.27 +/- 0.09). Indices of infarction (pathologic Q waves, fQRS, and Selvester QRS Score) were analyzed by blinded observers. In patients with QRS duration less than 120 milliseconds, number of leads with pathologic Q waves (mean, 1.6 +/- 1.7) correlated weakly with infarct volume (r = 0.30, P < .05). Adding fQRS increased the number of affected leads (3.6 +/- 2.5), but the significant correlation with infarct volume was lost (r = 0.02, P = .10). Selvester Score was the most accurate (mean, 5.9 +/- 4.9 points; r = 0.49; P < .001). Fragmented QRS was not predictive of infarct size in patients with QRS duration of at least 120 milliseconds (r = 0.02, P = .19). Thus, in ischemic cardiomyopathy, consideration of fQRS complexes does not improve Q wave prediction of infarct volume; but Selvester Score was more accurate.


Figures

Figure 1
Figure 1. Representative Electrocardiographic Indices of Infarction
This 12-lead ECG with the Mason-Likar lead configuration demonstrates pathological Q waves (II, III, aVF, V5 and V6) and fQRS complexes (II, III, aVF, aVL,V5, and V6) in the inferior and lateral lead. The Selvester QRS Score for this tracing was 5, which equates to an estimated infarct size of 15% of the LV. The infarct volume by PET was 22% of the LV.
Figure 2
Figure 2. Representative PET Images in Patients with Ischemic Cardiomyopathy
In these polar tomograms the apex of the LV is in the middle of each image, with the basal segments at the periphery. Normal tracer deposition (perfusion with 13N-ammonia on the left and viability with FDG on the right) is shown in dark red and dark blue denotes no tracer activity. The upper pair of tomograms is from a patient with a small infarct primarily involving the apex (6% of LV). The lower pair of tomograms shows extensive infarction involving the septal, anterior, anterolateral and apical regions (34% of the LV). (A – anterior, P – posterior, L – lateral, S – septal)
Figure 3
Figure 3. QRS Duration and Infarct Volume
Among all 138 patients QRS duration ranged from 85 to 238 msec (mean 140 ± 34 msec). Data from patients with QRS duration of < 120 ms (Narrow QRS) are represented by black diamonds, and those with QRS duration ≥ 120 ms (Wide QRS) are shown as white circles. There was no significant correlation between QRS duration and infarct volume (r = −0.14, p = 0.10).
Figure 4
Figure 4. Infarct Volume as Predicted by Q Waves Alone, fQRS Alone, or Q Waves Combined with fQRS
The left graph shows the correlation between infarct volume and the number of leads with pathologic Q waves (with leads V1 and aVR excluded) in patients with narrow QRS complexes (n = 52). Although the correlation was statistically significant, the relationship was weak and Q waves only accounted for 9% of the variability in infarct volume. The middle graph shows that although fQRS complexes are common in patients with ischemic cardiomyopathy, the number of leads with fQRS did not correlate with infarct volume. By combining Q waves and fQRS as indices of infarction (right graph), the number of affected leads significantly increased (to 3.6 ± 2.5, p < 0.001 vs. either Q waves or fQRS alone), but there was no improvement in the correlation with infarct volume than with Q waves alone.
Figure 5
Figure 5. Selvester QRS Score and Infarct Volume by PET Imaging with Narrow QRS Complexes
The left graph shows the correlation between infarct volume and the Selvester QRS Score. Among all patients with narrow QRS complexes (n = 52), the Selvester Score was moderately correlated with infarct size (black line, r = 0.48, p < 0.001). The correlation between Selvester QRS score and infarct volume among subjects with single infarcts (gray circles and dotted line; n = 13, r = 0.49, p = 0.09) was similar to that of subjects with multiple infarcts (black diamonds and dashed line; n = 39, r = 0.41, p=0.01). The Bland-Altman plot (right graph) shows the degree of agreement between infarct volumes using the PET and the Selvester QRS Score. The average infarct size by PET was similar to that estimated by the Selvester QRS Scores, with a mean difference of < 1% of the LV. There was no significant difference in predictive accuracy between subjects with single versus multiple infarcts. The horizontal dotted lines denote the 95% confidence limits.
Figure 6
Figure 6. fQRS and Infarct Volume by PET Imaging with Wide QRS Complexes
Among patients with a QRS duration ≥ 120 ms, there was no correlation between infarct volume and the number of ECG leads with an fQRS complex (n = 86).

References

    1. Feola M, Biggi A, Chauvie S, et al. Myocardial scar and insulin resistance predict cardiovascular events in severe ischaemic myocardial dysfunction: a perfusion-metabolism positron emission tomography study. Nucl Med Commun. 2008;29:448–54. - PubMed
    1. Yokota H, Heidary S, Katikireddy CK, et al. Quantitative characterization of myocardial infarction by cardiovascular magnetic resonance predicts future cardiovascular events in patients with ischemic cardiomyopathy. J Cardiovasc Magn Reson. 2008;10:17. - PMC - PubMed
    1. Beanlands RS, Ruddy TD, deKemp RA, et al. Positron emission tomography and recovery following revascularization (PARR-1): the importance of scar and the development of a prediction rule for the degree of recovery of left ventricular function. J Am Coll Cardiol. 2002;40:1735–1743. - PubMed
    1. Allman KC, Shaw LJ, Hachamovitch R, Udelson JE. Myocardial viability testing and impact of revascularization on prognosis in patients with coronary artery disease and left ventricular dysfunction: a meta-analysis. J Am Coll Cardiol. 2002;39:1151–1158. - PubMed
    1. Engblom H, Hedstrom E, Heiberg E, et al. Size and transmural extent of first-time reperfused myocardial infarction assessed by cardiac magnetic resonance can be estimated by 12-lead electrocardiogram. Am Heart J. 2005;150:920. - PubMed

Publication types