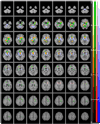
Regional brain metabolic correlates of self-reported depression severity contrasted with clinician ratings
- PMID: 20381874
- PMCID: PMC3580232
- DOI: 10.1016/j.jad.2010.03.002
Regional brain metabolic correlates of self-reported depression severity contrasted with clinician ratings
Abstract
Background: We compared brain-map correlations of relative cerebral glucose metabolism (rCMRglu) with psychopathologic factors derived from the self-rated Beck Depression Inventory (BDI) and factors from the clinician-rated Hamilton Depression Rating Scale (HDRS) factors, seeking an anatomic basis for differences in self and clinician ratings.
Methods: [(18)F]-FDG Positron Emission Tomography generated rCMRglu, SPM-estimated, voxel-level, brain correlation maps with BDI factor scores and HDRS factor scores in medication-free major depressive disorder.
Results: Regional brain correlates of BDI are more extensive than HDRS, even when adjusting for variance accounted for by the HDRS. Factors comprising the BDI were associated with distinct cortical and subcortical regions. The degree of overlap in factor correlation brain maps is explained by the variance shared by BDI and HDRS factor scores.
Conclusion: Self and clinician-rated aspects of depression have common and distinct neuroanatomic correlates that reflect correlations between rating scales, but correlations between glucose metabolism and self-rated depression were anatomically more extensive in this sample. Findings highlight the importance and biological underpinnings of these subjective features of major depression.
Copyright 2010 Elsevier B.V. All rights reserved.
Conflict of interest statement
Dr. Mann has unrelated grants from Novartis and GSK, all other authors declare that they have no conflicts of interest.
Figures


Similar articles
-
Neuroanatomic correlates of psychopathologic components of major depressive disorder.Arch Gen Psychiatry. 2005 Apr;62(4):397-408. doi: 10.1001/archpsyc.62.4.397. Arch Gen Psychiatry. 2005. PMID: 15809407
-
Regional cerebral glucose utilization in patients with a range of severities of unipolar depression.Biol Psychiatry. 2002 Feb 1;51(3):237-52. doi: 10.1016/s0006-3223(01)01216-1. Biol Psychiatry. 2002. PMID: 11839367
-
Resting regional brain activity correlates of verbal learning deficit in major depressive disorder.Psychiatry Res Neuroimaging. 2019 Jan 30;283:96-103. doi: 10.1016/j.pscychresns.2018.12.006. Epub 2018 Dec 8. Psychiatry Res Neuroimaging. 2019. PMID: 30580237
-
Sleep deprivation PET correlations of Hamilton symptom improvement ratings with changes in relative glucose metabolism in patients with depression.J Affect Disord. 2008 Apr;107(1-3):181-6. doi: 10.1016/j.jad.2007.07.030. Epub 2007 Nov 26. J Affect Disord. 2008. PMID: 18031825
-
[Use of antidepressant drugs in schizophrenic patients with depression].Encephale. 2006 Mar-Apr;32(2 Pt 1):263-9. doi: 10.1016/s0013-7006(06)76153-x. Encephale. 2006. PMID: 16910628 Review. French.
Cited by
-
A Pilot Study of Safety and Efficacy of Cranial Electrotherapy Stimulation in Treatment of Bipolar II Depression.J Nerv Ment Dis. 2015 Nov;203(11):827-35. doi: 10.1097/NMD.0000000000000378. J Nerv Ment Dis. 2015. PMID: 26414234 Free PMC article. Clinical Trial.
-
Diffusion tensor imaging brain structural clustering patterns in major depressive disorder.Hum Brain Mapp. 2021 Oct 15;42(15):5023-5036. doi: 10.1002/hbm.25597. Epub 2021 Jul 27. Hum Brain Mapp. 2021. PMID: 34312935 Free PMC article.
-
Regional brain glucose uptake distinguishes suicide attempters from non-attempters in major depression.Arch Suicide Res. 2013;17(4):434-47. doi: 10.1080/13811118.2013.801813. Arch Suicide Res. 2013. PMID: 24224676 Free PMC article. Clinical Trial.
-
Suicidal ideation and the subjective aspects of depression.J Affect Disord. 2012 Sep;140(1):75-81. doi: 10.1016/j.jad.2012.01.045. Epub 2012 Mar 9. J Affect Disord. 2012. PMID: 22406338 Free PMC article.
-
Motor performance and functional connectivity between the posterior cingulate cortex and supplementary motor cortex in bipolar and unipolar depression.Eur Arch Psychiatry Clin Neurosci. 2024 Apr;274(3):655-671. doi: 10.1007/s00406-023-01671-1. Epub 2023 Aug 28. Eur Arch Psychiatry Clin Neurosci. 2024. PMID: 37638997 Free PMC article.
References
-
- Adda C, Lefevre B, Reimao R. Narcolepsy and depression. Arq. Neuropsiquiatr. 1997;55:423–426. - PubMed
-
- Akdemir A, Turkcapar MH, Orsel SD, Demirergi N, Dag I, Ozbay MH. Reliability and validity of the Turkish version of the Hamilton Depression Rating Scale. Compr. Psychiatry. 2001;42:161–165. - PubMed
-
- Ambrosini PJ, Wagner KD, Biederman J, Glick I, Tan C, Elia J, Hebeler JR, Rabinovich H, Lock J, Geller D. Multicenter open-label sertraline study in adolescent outpatients with major depression. J. Am. Acad. Child Adolesc. Psychiatry. 1999;38:566–572. - PubMed
-
- American Psychiatric Association, T.F.o.D.-I. Diagnostic and Statistical Manual of Mental Disorders: DSM-IV. Washington, DC: American Psychiatric Association; 1994.
-
- Andersson S, Bergedalen AM. Cognitive correlates of apathy in traumatic brain injury. Neuropsychiatry Neuropsychol. Behav. Neurol. 2002;15:184–191. - PubMed
Publication types
MeSH terms
Substances
Grants and funding
LinkOut - more resources
Full Text Sources

