

Quantification of condylar resorption in temporomandibular joint osteoarthritis
- PMID: 20382043
- PMCID: PMC2900430
- DOI: 10.1016/j.tripleo.2010.01.008
Quantification of condylar resorption in temporomandibular joint osteoarthritis
Abstract
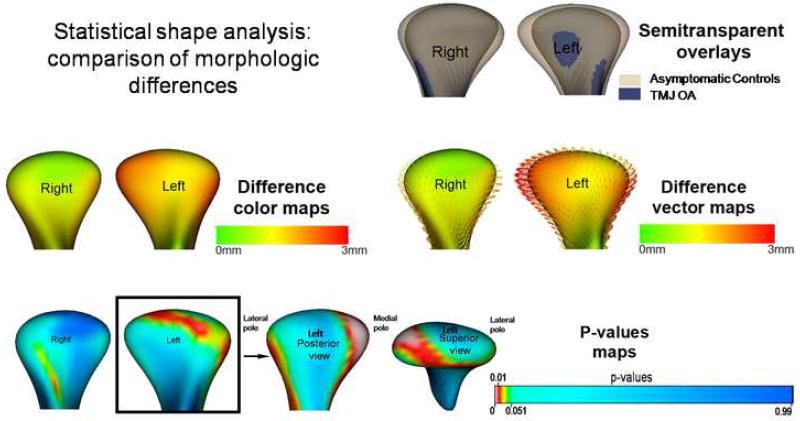
Objective: This study was performed to determine the condylar morphologic variation of osteoarthritic (OA) and asymptomatic temporomandibular joints (TMJs) and to determine its correlation with pain intensity and duration.
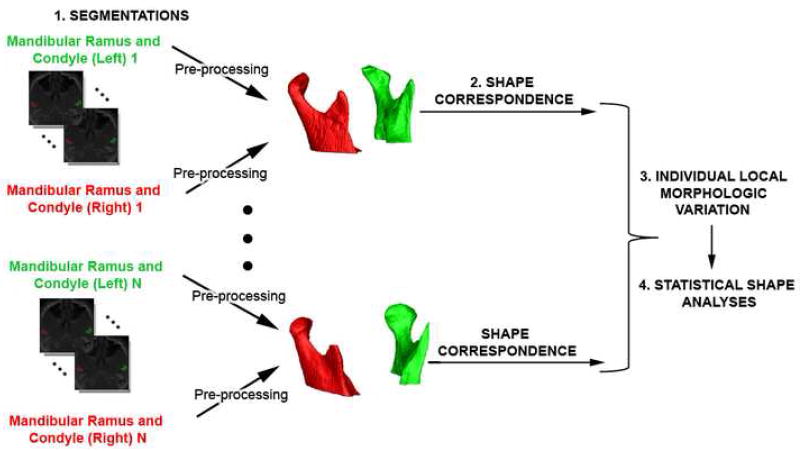
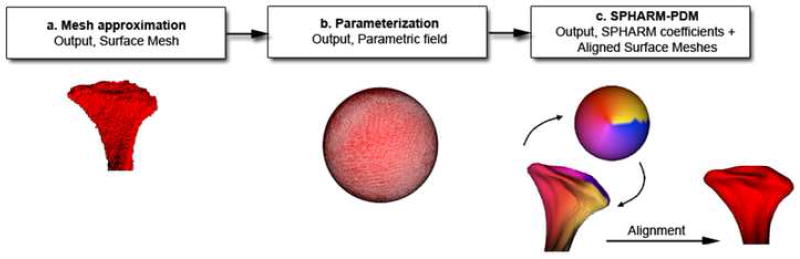
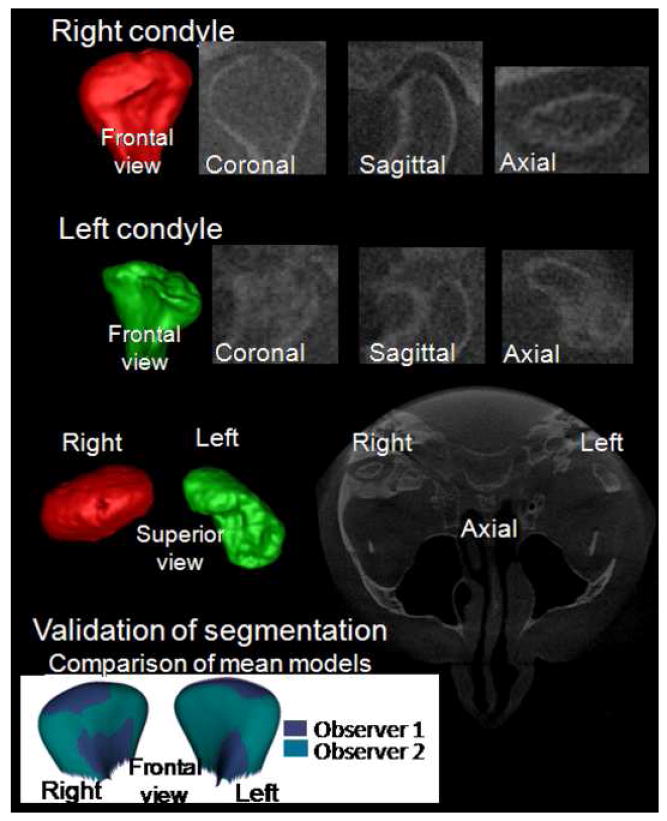
Study design: Three-dimensional surface models of mandibular condyles were constructed from cone-beam computerized tomography images of 29 female patients with TMJ OA (Research Diagnostic Criteria for Temporomandibular Disorders group III) and 36 female asymptomatic subjects. Shape correspondence was used to localize and quantify the condylar morphology. Statistical analysis was performed with multivariate analysis of covariance analysis, using Hotelling T(2) metric based on covariance matrices, and Pearson correlation.
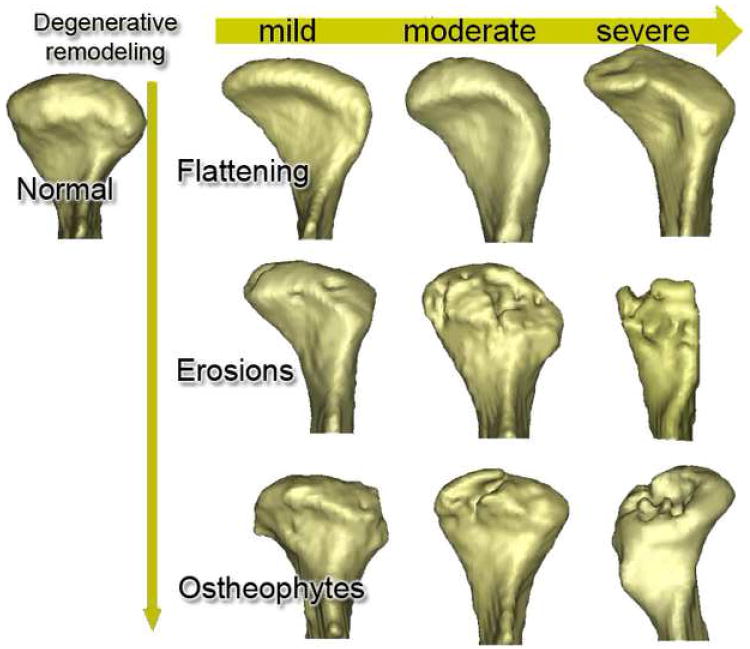
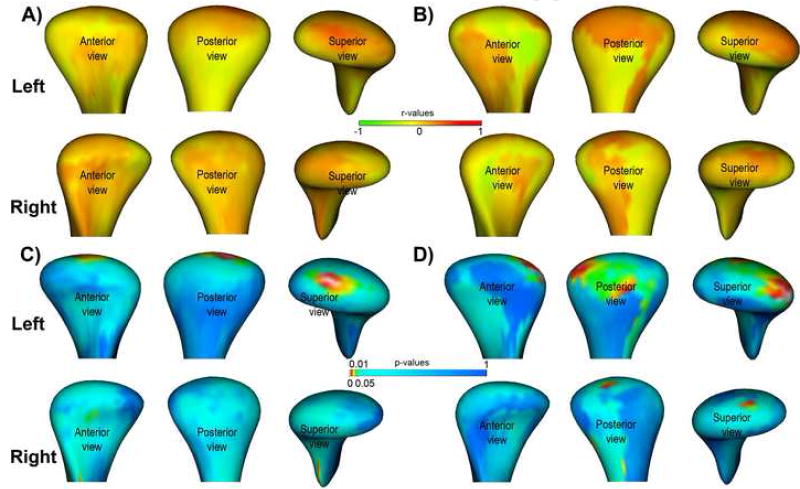
Results: The OA condylar morphology was statistically significantly different from the asymptomatic condyles (P < .05). Three-dimensional morphologic variation of the OA condyles was significantly correlated with pain intensity and duration.
Conclusion: Three-dimensional quantification of condylar morphology revealed profound differences between OA and asymptomatic condyles, and the extent of the resorptive changes paralleled pain severity and duration.
Copyright (c) 2010 Mosby, Inc. All rights reserved.
Figures
Similar articles
-
Effects of condylar head surface changes on mandibular position in patients with temporomandibular joint osteoarthritis.J Craniomaxillofac Surg. 2015 Oct;43(8):1380-3. doi: 10.1016/j.jcms.2015.06.031. Epub 2015 Jun 27. J Craniomaxillofac Surg. 2015. PMID: 26209414
-
A study on volumetric change of mandibular condyles with osteoarthritis using cone-beam computed tomography.Sci Rep. 2024 May 3;14(1):10232. doi: 10.1038/s41598-024-60404-z. Sci Rep. 2024. PMID: 38702404 Free PMC article.
-
Regional 3D superimposition to assess temporomandibular joint condylar morphology.Dentomaxillofac Radiol. 2014;43(1):20130273. doi: 10.1259/dmfr.20130273. Epub 2013 Oct 29. Dentomaxillofac Radiol. 2014. PMID: 24170802 Free PMC article.
-
3D superimposition and understanding temporomandibular joint arthritis.Orthod Craniofac Res. 2015 Apr;18 Suppl 1(0 1):18-28. doi: 10.1111/ocr.12070. Orthod Craniofac Res. 2015. PMID: 25865530 Free PMC article.
-
CBCT analysis of bony changes associated with temporomandibular disorders.Cranio. 2016 Mar;34(2):88-94. doi: 10.1179/2151090315Y.0000000002. Cranio. 2016. PMID: 25672907
Cited by
-
Intra-articular calcifications of the temporomandibular joint and associations with degenerative bone alterations.Imaging Sci Dent. 2020 Jun;50(2):99-104. doi: 10.5624/isd.2020.50.2.99. Epub 2020 Jun 18. Imaging Sci Dent. 2020. PMID: 32601584 Free PMC article.
-
Differences between the temporal and mandibular components of the temporomandibular joint in topographic distribution of osseous degenerative features on cone-beam computerized tomography.J Dent Sci. 2021 Jul;16(3):1010-1017. doi: 10.1016/j.jds.2020.12.010. Epub 2021 Mar 3. J Dent Sci. 2021. PMID: 34141117 Free PMC article.
-
Long-term Changes of Temporomandibular Joint Osteoarthritis on Computed Tomography.Sci Rep. 2020 Apr 21;10(1):6731. doi: 10.1038/s41598-020-63493-8. Sci Rep. 2020. PMID: 32317672 Free PMC article.
-
Comparison of Morphologic Parameters of Temporomandibular Joint for Asymptomatic Subjects Using the Two-Dimensional and Three-Dimensional Measuring Methods.J Healthc Eng. 2017;2017:5680708. doi: 10.1155/2017/5680708. Epub 2017 May 2. J Healthc Eng. 2017. PMID: 29065621 Free PMC article.
-
CBCT and MRT imaging in patients clinically diagnosed with temporomandibular joint arthralgia.Heliyon. 2018 Jun 5;4(6):e00641. doi: 10.1016/j.heliyon.2018.e00641. eCollection 2018 Jun. Heliyon. 2018. PMID: 30003149 Free PMC article.
References
-
- De Leeuw R. American Academy of Orofacial Pain Guidelines for Assessment, Diagnosis, and Management. 4. Chicago: Quintessence Publishing Co; 2008.
-
- LeResche L. Epidemiology of temporomandibular disorders: Implications for the investigation of etiologic factors. Crit Rev Oral Biol Med. 1997;8:291–305. - PubMed
-
- Helenius LM, Tervahartiala P, Helenius I, Al-Sukhun J, Kivisaari L, Suuronen R, et al. Clinical, radiographic and MRI findings of the temporomandibular joint in patients with different rheumatic diseases. Int J Oral Maxillofac Surg. 2006;35:983–989. - PubMed
-
- Alstergren P, Kopp S. Insufficient endogeneous control of tumor necrosis factor-α contributes to temporomandibular joint pain and tissue destruction in rheumatoid arthritis. J Rheumatol. 2006;33:1734–1739. - PubMed
-
- Hajati A-K. Early signs of bone tissue resorption in the TMJ of patients with recent diagnosis of rheumatoid arthritis. In: McNamara JA Jr, Kapila SD, editors. Temporomandibular Disorders and Orofacial Pain: Separating Controversy from Consensus Monograph 46, Craniofacial Growth Series, Department of Orthodontics and Pediatric Dentistry and Center for Human Growth and Development, The University of Michigan, Ann Arbor. 2009. pp. 147–157.
Publication types
MeSH terms
Grants and funding
LinkOut - more resources
Full Text Sources
Medical
