

Urocortin 2 increases c-Fos expression in serotonergic neurons projecting to the ventricular/periventricular system
- PMID: 20382145
- PMCID: PMC2885541
- DOI: 10.1016/j.expneurol.2010.04.002
Urocortin 2 increases c-Fos expression in serotonergic neurons projecting to the ventricular/periventricular system
Abstract
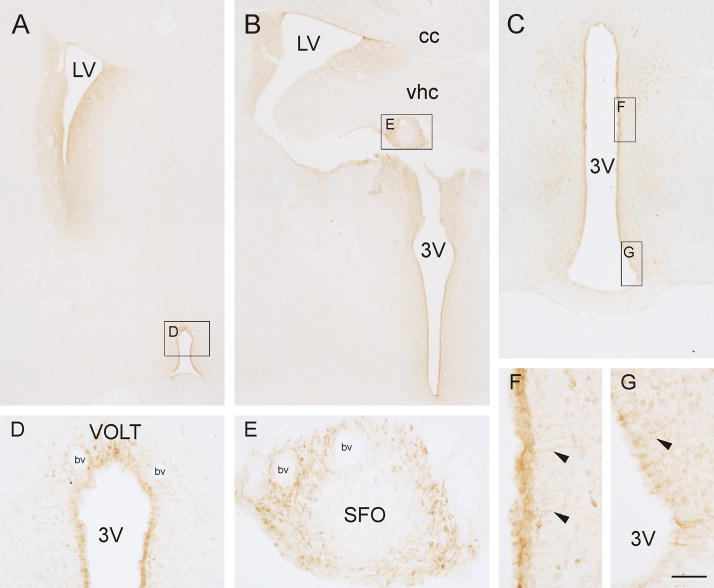
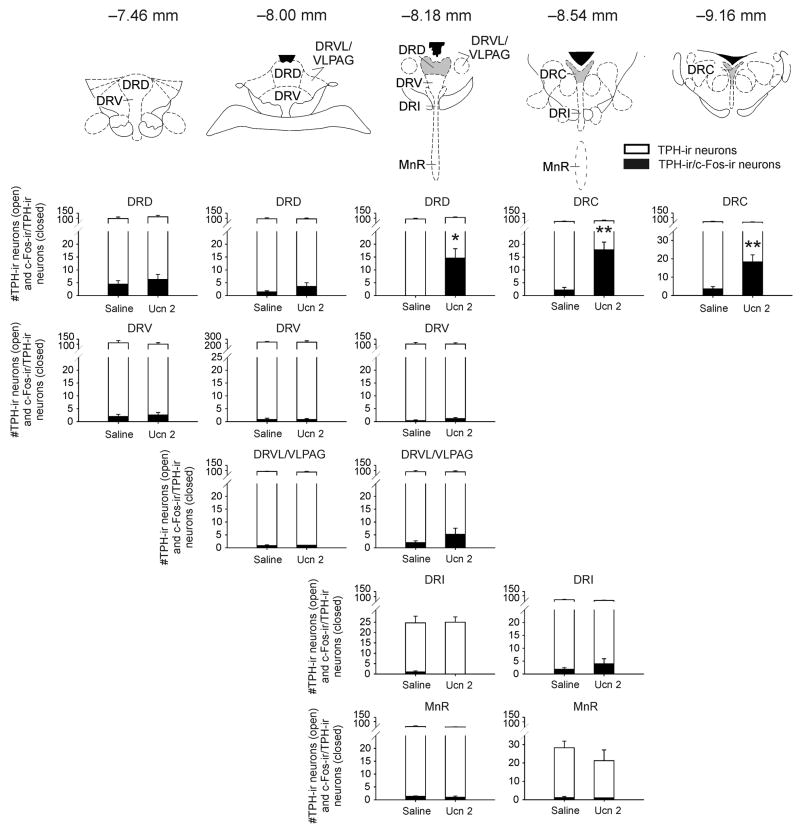
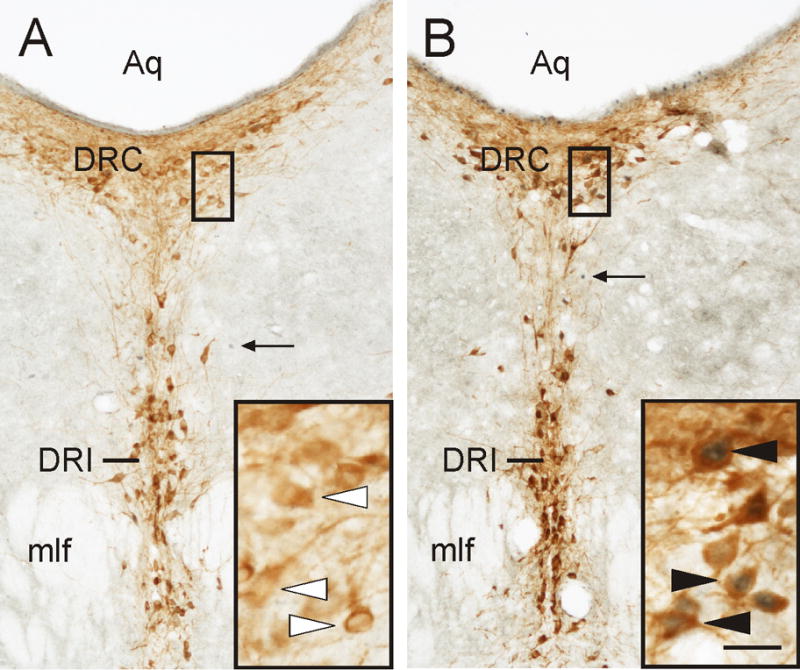
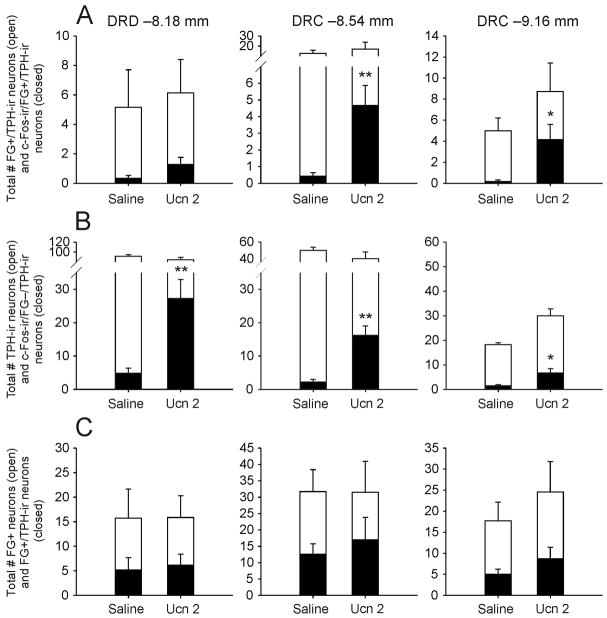
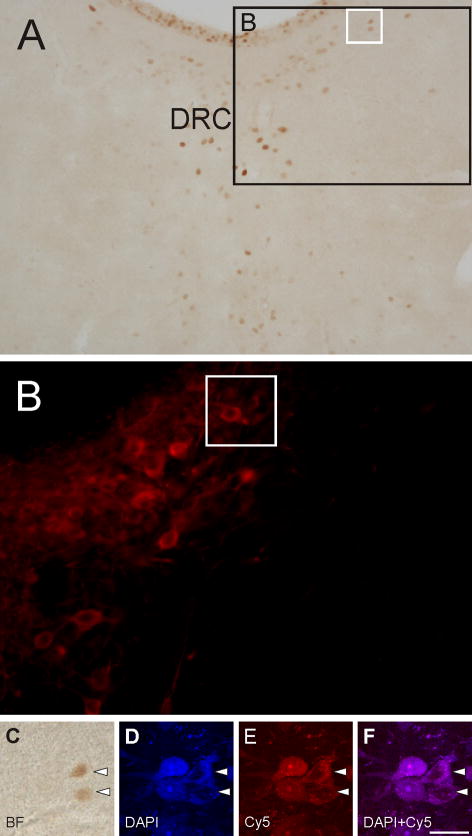
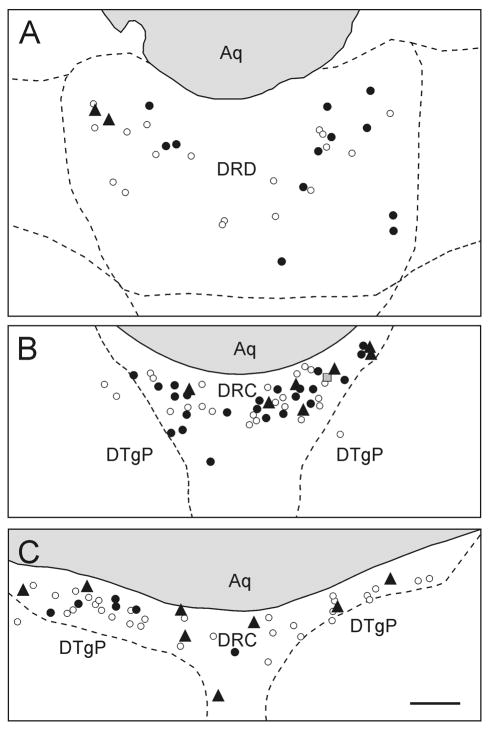
Serotonin plays an important role in the regulation of anxiety states and physiological responses to aversive stimuli. Intracerebroventricular (i.c.v.) injection of the stress- and anxiety-related neuropeptide urocortin 2 (Ucn 2) increases c-Fos expression in serotonergic neurons in the dorsal (DRD) and caudal (DRC) parts of the dorsal raphe nucleus. These regions contain a subset of serotonergic neurons that projects via the dorsal raphe periventricular tract to periventricular structures, including the subfornical organ and ependymal layer, and to the ventricular system. To determine if Ucn 2 activates ventricle/periventricular-projecting serotonergic neurons in the midbrain raphe complex, we made i.c.v. injections of the retrograde tracer Fluoro-Gold into the lateral ventricle, followed 7 days later by i.c.v. injection of Ucn 2. The DRD at -8.18 mm and the DRC at -8.54 mm and -9.16 mm bregma were analyzed using a combined bright field and immunofluorescence technique. Approximately 40% of the ventricle/periventricular-projecting neurons in the subdivisions sampled were serotonergic. Urocortin 2 increased c-Fos expression in ventricle/periventricular-projecting serotonergic neurons in the DRC and in non-ventricle/periventricular-projecting serotonergic neurons in the DRD and DRC. Of the total population of ventricle/periventricular-projecting serotonergic neurons in the DRC at -8.54 and -9.16 mm bregma, 35% expressed c-Fos following Ucn 2 injections. These data are consistent with previous studies showing that i.c.v. injection of Ucn 2 activates subpopulations of serotonergic neurons restricted to the mid-rostrocaudal DRD and DRC and further demonstrate that these include both subsets of serotonergic neurons that do and do not project to the ventricle/periventricular system.
Published by Elsevier Inc.
Figures
Similar articles
-
Urocortin 2 increases c-Fos expression in topographically organized subpopulations of serotonergic neurons in the rat dorsal raphe nucleus.Brain Res. 2005 May 24;1044(2):176-89. doi: 10.1016/j.brainres.2005.02.080. Epub 2005 Apr 15. Brain Res. 2005. PMID: 15885216
-
Evidence supporting a role for corticotropin-releasing factor type 2 (CRF2) receptors in the regulation of subpopulations of serotonergic neurons.Brain Res. 2006 Jan 27;1070(1):77-89. doi: 10.1016/j.brainres.2005.10.096. Epub 2006 Jan 3. Brain Res. 2006. PMID: 16403469
-
Injections of urocortin 1 into the basolateral amygdala induce anxiety-like behavior and c-Fos expression in brainstem serotonergic neurons.Neuroscience. 2006;138(4):1265-76. doi: 10.1016/j.neuroscience.2005.12.051. Epub 2006 Feb 20. Neuroscience. 2006. PMID: 16488545
-
Stress-related serotonergic systems: implications for symptomatology of anxiety and affective disorders.Cell Mol Neurobiol. 2012 Jul;32(5):695-708. doi: 10.1007/s10571-012-9827-1. Epub 2012 Apr 7. Cell Mol Neurobiol. 2012. PMID: 22484834 Free PMC article. Review.
-
Serotonergic systems, anxiety, and affective disorder: focus on the dorsomedial part of the dorsal raphe nucleus.Ann N Y Acad Sci. 2008 Dec;1148:86-94. doi: 10.1196/annals.1410.004. Ann N Y Acad Sci. 2008. PMID: 19120094 Review.
Cited by
-
Role of canonical and non-canonical cAMP sources in CRHR2α-dependent signaling.PLoS One. 2024 Oct 2;19(10):e0310699. doi: 10.1371/journal.pone.0310699. eCollection 2024. PLoS One. 2024. PMID: 39356686 Free PMC article.
-
Specific Connectivity and Unique Molecular Identity of MET Receptor Tyrosine Kinase Expressing Serotonergic Neurons in the Caudal Dorsal Raphe Nuclei.ACS Chem Neurosci. 2017 May 17;8(5):1053-1064. doi: 10.1021/acschemneuro.7b00020. Epub 2017 May 1. ACS Chem Neurosci. 2017. PMID: 28375615 Free PMC article.
-
Stress Modulation of Opposing Circuits in the Bed Nucleus of the Stria Terminalis.Neuropsychopharmacology. 2016 Jan;41(1):103-25. doi: 10.1038/npp.2015.178. Epub 2015 Jun 22. Neuropsychopharmacology. 2016. PMID: 26096838 Free PMC article. Review.
-
A triple urocortin knockout mouse model reveals an essential role for urocortins in stress recovery.Proc Natl Acad Sci U S A. 2010 Nov 2;107(44):19020-5. doi: 10.1073/pnas.1013761107. Epub 2010 Oct 11. Proc Natl Acad Sci U S A. 2010. PMID: 20937857 Free PMC article.
-
Axonal control of the adult neural stem cell niche.Cell Stem Cell. 2014 Apr 3;14(4):500-11. doi: 10.1016/j.stem.2014.01.014. Epub 2014 Feb 20. Cell Stem Cell. 2014. PMID: 24561083 Free PMC article.
References
-
- Abrams JK, Johnson PL, Hay-Schmidt A, Mikkelsen JD, Shekhar A, Lowry CA. Serotonergic systems associated with arousal and vigilance behaviors following administration of anxiogenic drugs. Neuroscience. 2005;133:983–997. - PubMed
-
- Amat J, Tamblyn JP, Paul ED, Bland ST, Amat P, Foster AC, Watkins LR, Maier SF. Microinjection of urocortin 2 into the dorsal raphe nucleus activates serotonergic neurons and increases extracellular serotonin in the basolateral amygdala. Neuroscience. 2004;129:509–519. - PubMed
-
- Asberg M. Neurotransmitters and suicidal behavior. The evidence from cerebrospinal fluid studies. Ann N Y Acad Sci. 1997;836:158–181. - PubMed
-
- Azmitia EC, Jr, Segal M. An autoradiographic analysis of the differential ascending projection of the dorsal and median raphe nuclei in the rat. J Comp Neurol. 1978;179:651–668. - PubMed
-
- Bale TL, Contarino A, Smith GW, Chan R, Gold LH, Sawchenko PE, Koob GF, Vale WW, Lee KF. Mice deficient for corticotropin-releasing hormone receptor-2 display anxiety-like behaviour and are hypersensitive to stress. Nat Genet. 2000;24:410–414. - PubMed
Publication types
MeSH terms
Substances
Grants and funding
LinkOut - more resources
Full Text Sources
