

High-resolution BOLD fMRI measurements of local orientation-dependent contextual modulation show a mismatch between predicted V1 output and local BOLD response
- PMID: 20382175
- PMCID: PMC2904084
- DOI: 10.1016/j.visres.2010.04.005
High-resolution BOLD fMRI measurements of local orientation-dependent contextual modulation show a mismatch between predicted V1 output and local BOLD response
Abstract
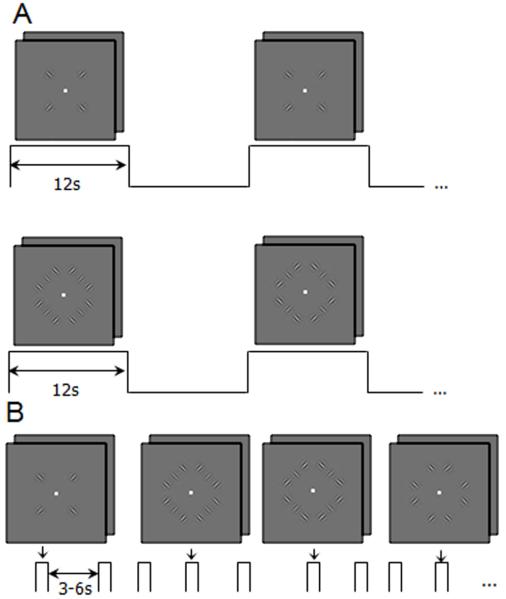
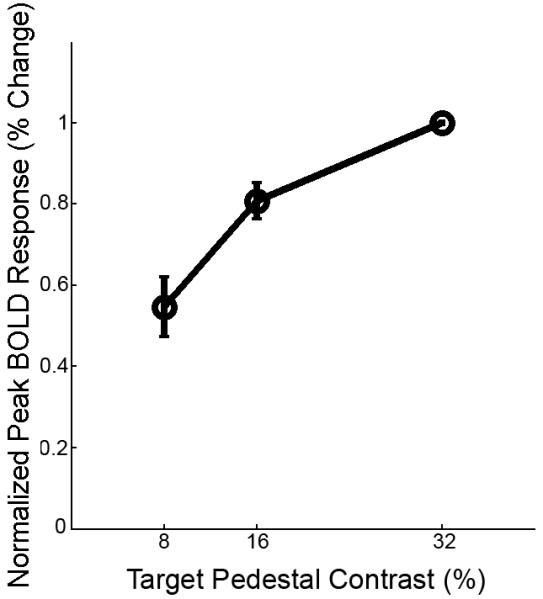
The blood oxygenation level-dependent (BOLD) functional MRI response to suppressive neural activity has not been tested on a fine spatial scale. Using Gabor patches placed in the near periphery, we precisely localized individual regions of interest in primary visual cortex and measured the response at a range of contrasts in two different contexts: with parallel and with orthogonal flanking Gabor patches. Psychophysical measurements confirmed strong suppression of the target Gabor response when flanked by parallel Gabors. However, the BOLD response to the target with parallel flankers decreased as the target contrast increased, which contradicts psychophysical estimates of local neural activity.
Published by Elsevier Ltd.
Figures


Similar articles
-
Functional MRI, ERP, and psychophysical measures show that contextual effects are orientation tuned and suppressive.J Vis. 2017 Dec 1;17(14):1. doi: 10.1167/17.14.1. J Vis. 2017. PMID: 29196759
-
BOLD fMRI and psychophysical measurements of contrast response to broadband images.Vision Res. 2004 Mar;44(7):669-83. doi: 10.1016/j.visres.2003.10.022. Vision Res. 2004. PMID: 14751552
-
Negative BOLD fMRI response in the visual cortex carries precise stimulus-specific information.PLoS One. 2007 May 2;2(5):e410. doi: 10.1371/journal.pone.0000410. PLoS One. 2007. PMID: 17476332 Free PMC article.
-
Feature-Based Attention Multiplicatively Scales the fMRI-BOLD Contrast-Response Function.J Neurosci. 2022 Sep 7;42(36):6894-6906. doi: 10.1523/JNEUROSCI.0513-22.2022. J Neurosci. 2022. PMID: 35868860 Free PMC article.
-
Response suppression in v1 agrees with psychophysics of surround masking.J Neurosci. 2003 Jul 30;23(17):6884-93. doi: 10.1523/JNEUROSCI.23-17-06884.2003. J Neurosci. 2003. PMID: 12890783 Free PMC article.
Cited by
-
The effects of orientation and attention during surround suppression of small image features: A 7 Tesla fMRI study.J Vis. 2016 Aug 1;16(10):19. doi: 10.1167/16.10.19. J Vis. 2016. PMID: 27565016 Free PMC article.
-
Fovea-periphery axis symmetry of surround modulation in the human visual system.PLoS One. 2013;8(2):e57906. doi: 10.1371/journal.pone.0057906. Epub 2013 Feb 28. PLoS One. 2013. PMID: 23469101 Free PMC article.
-
Contrast Response Functions for Single Gabor Patches: ROI-Based Analysis Over-Represents Low-Contrast Patches for GE BOLD.Front Syst Neurosci. 2011 Mar 24;5:19. doi: 10.3389/fnsys.2011.00019. eCollection 2011. Front Syst Neurosci. 2011. PMID: 21483782 Free PMC article.
-
What multiplexing means for the interpretation of functional MRI data.Front Hum Neurosci. 2023 Apr 6;17:1134811. doi: 10.3389/fnhum.2023.1134811. eCollection 2023. Front Hum Neurosci. 2023. PMID: 37091812 Free PMC article.
-
What insights can fMRI offer into the structure and function of mid-tier visual areas?Vis Neurosci. 2015 Jan;32:E015. doi: 10.1017/S0952523815000127. Vis Neurosci. 2015. PMID: 26241199 Free PMC article.
References
-
- Amir Y, Harel M, Malach R. Cortical hierarchy reflected in the organization of intrinsic connections in macaque monkey visual cortex. J Comp Neurol. 1993;334(1):19–46. - PubMed
-
- Attwell D, Laughlin SB. An energy budget for signaling in the grey matter of the brain. Journal of Cerebral Blood Flow and Metabolism. 2001;21:1133–1145. - PubMed
-
- Bandettini PA, Jesmanowicz A, Wong EC, Hyde JS. Processing strategies for time-course data sets in functional MRI of the human brain. Magnetic Resonance in Medicine. 1993;30:161–173. - PubMed
Publication types
MeSH terms
Grants and funding
LinkOut - more resources
Full Text Sources
Medical
