. 2010 Jul;39(1):85-97.
doi: 10.1016/j.nbd.2010.04.001. Epub 2010 Apr 9.

Microglial ablation and lipopolysaccharide preconditioning affects pilocarpine-induced seizures in mice

Affiliations

Microglial ablation and lipopolysaccharide preconditioning affects pilocarpine-induced seizures in mice

Martine M Mirrione et al. Neurobiol Dis. 2010 Jul.

Abstract

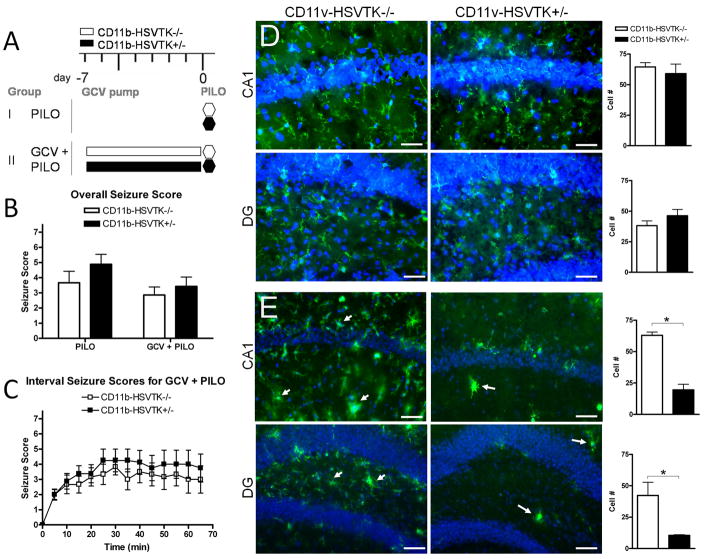
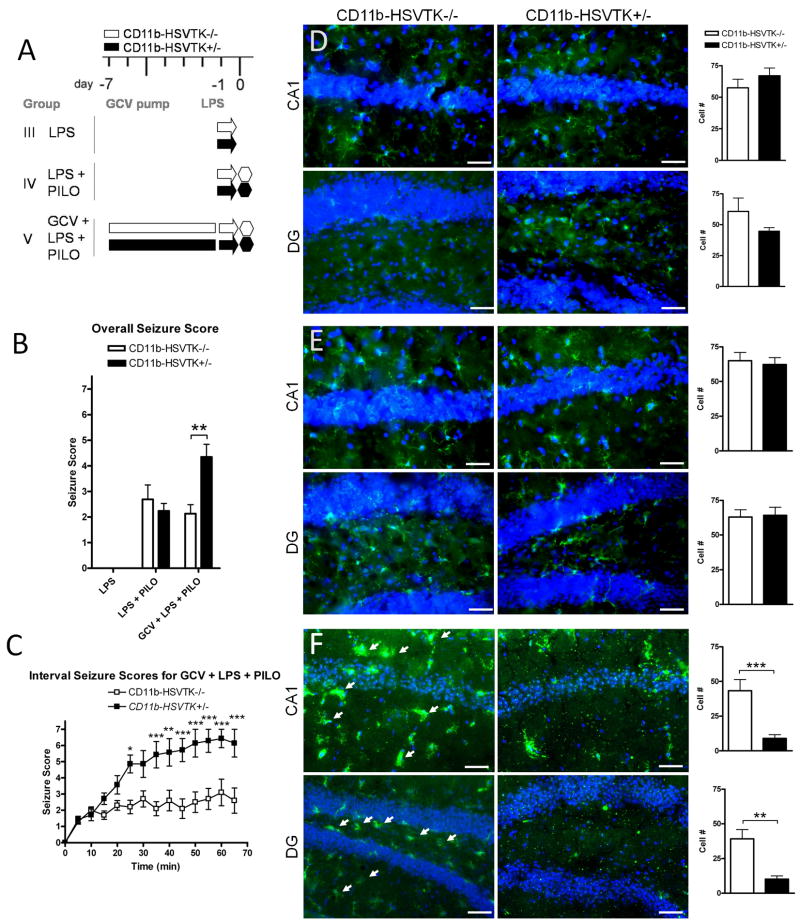
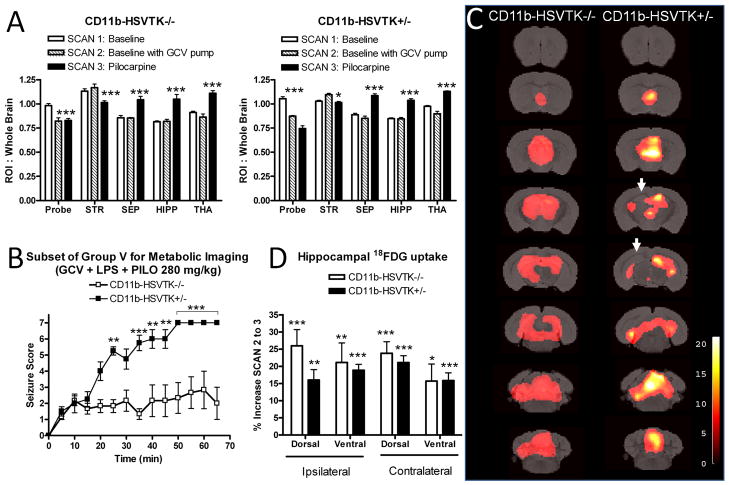
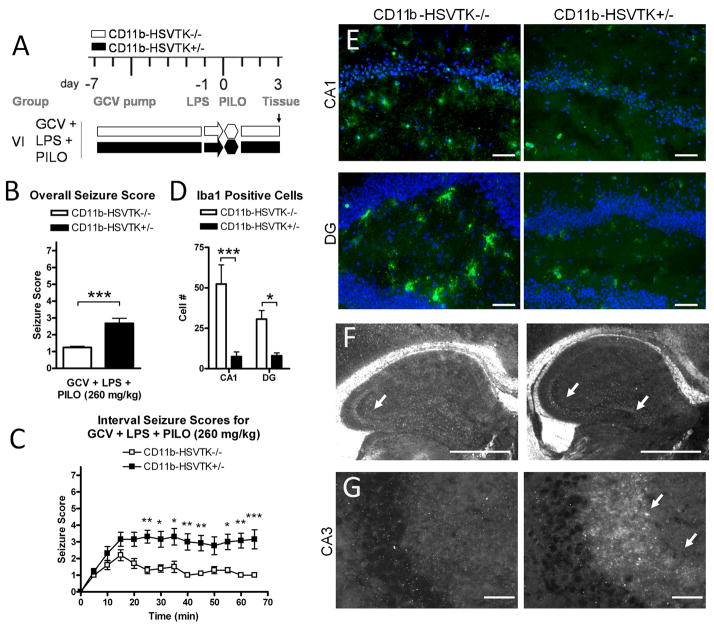
Activated microglia have been associated with neurodegeneration in patients and in animal models of Temporal Lobe Epilepsy (TLE), however their precise functions as neurotoxic or neuroprotective is a topic of significant investigation. To explore this, we examined the effects of pilocarpine-induced seizures in transgenic mice where microglia/macrophages were conditionally ablated. We found that unilateral ablation of microglia from the dorsal hippocampus did not alter acute seizure sensitivity. However, when this procedure was coupled with lipopolysaccharide (LPS) preconditioning (1 mg/kg given 24 h prior to acute seizure), we observed a significant pro-convulsant phenomenon. This effect was associated with lower metabolic activation in the ipsilateral hippocampus during acute seizures, and could be attributed to activity in the mossy fiber pathway. These findings reveal that preconditioning with LPS 24 h prior to seizure induction may have a protective effect which is abolished by unilateral hippocampal microglia/macrophage ablation.


Conflict of interest statement

The authors declare no competing financial interests.

Figures

Figure 1
Figure 1. Quiescent hippocampal microglia do not modulate seizure threshold
A) Schematic of experimental design in group I: PILO (pilocarpine only) and II: GCV + PILO (gancyclovir [GCV] infusion before pilocarpine) representing each genotype, white bars are CD11b-HSVK−/− (wild type mice lacking the transgene) and black bars are CD11b-HSVTK+/− (transgenic mice susceptible to microglia ablation by GCV). Administration of pilocarpine (280 mg/kg i.p.) is denoted by a hexagon at day 0 (and is always preceded 15–30 min by methylscopolamine, 2 mg/kg i.p.). Infusion of GCV (for 7 days) is denoted by the rectangular bars from day −7 to 0. B) Following pilocarpine injection, seizure symptoms were continuously recorded, the maximum score during each 5 minute interval was listed over the 60 minute observation period for each animal and averaged by genotype and group providing the overall seizure score. C) The maximum score during each 5 min interval was plotted over time, data points represent the average score ± S.E.M. for each set of animals. D–E) Tissue was collected 2 hours post seizure induction and stained with Iba1 (green fluorescence) for microglia/macrophages. Iba1 is upregulated in activated cells. CA1 and hilar region of the dentate gyrus (DG) are shown with nuclei (DAPI). Panels in D represent group I, and E group II. Arrows in E indicate activated microglia/macrophages. To the right of each set of panels is quantification of Iba1+ cell number counted at 40× in regions of interest (ROIs) sized 300×400μm2 for each group (scale bar 50 μm, two-way ANOVA, Bonferroni post tests, * = p<0.05, data in all graphs plotted as average ± S.E.M.).
Figure 2
Figure 2. Preconditioning microglia with LPS affects seizure severity differently in CD11b-HSVTK−/− and CD11b-HSVTK+/− mice
A) Schematic of experimental design in group III: LPS (arrows designate lipopolysaccharide [LPS] only, 1 mg/kg i.p.), IV: LPS + PILO (LPS given 24 hours prior to piloarpine [PILO] injection 280 mg/kg i.p.), and V: GCV + LPS + PILO (gancyclovir [GCV] infusion, LPS given at day −1, then pilocarpine given 24 hours later, 280 mg/kg i.p.). Each genotype is represented, white bars for CD11b-HSVK−/− (wild type mice lacking the transgene) and black bars for CD11b-HSVTK+/− (transgenic mice susceptible to microglia ablation by GCV). Administration of pilocarpine is denoted by a hexagon at day 0 (and is always preceded 15–30 min by methylscopolamine, 2 mg/kg i.p.). Infusion of GCV (for 7 days which continues throughout the experiment) is denoted by the rectangular bars from day −7 to 0. B) Following pilocarpine injection, seizure symptoms were continuously recorded; the maximum score during each 5 minute interval was listed over the 60 minute observation period for each animal and averaged by genotype and group providing the overall seizure score. C) The maximum score during each 5 min interval was plotted over time, data points represent the average score ± S.E.M. for each set of animals. D–F) Tissue was collected 2 hours post seizure induction and stained with Iba1 (green fluorescence) for microglia/macrophages. Iba1 is upregulated in activated cells. CA1 and hilar region of the dentate gyrus (DG) are shown with nuclei (DAPI). Panels in D represent group III, E group IV, and F group V. Arrows in F indicate activated microglia/macrophages. The wild type DG panel in F was taken at slightly different coordinates (a more medial aspect of the granule cell layer). To the right of each set of panels is quantification of Iba1+ cell number counted at 40× in regions of interest (ROIs) sized 300×400μm2 for each group (scale bar 50 μm, two-way ANOVA, Bonferroni post tests, * = p<0.05, ** = p<0.01, *** = p<0.001, data in all graphs plotted as average ± S.E.M.).
Figure 3
Figure 3. Metabolic correlates of seizures and microglia/macrophages in LPS preconditioned mice
A) A subset of animals from group V were used for serial metabolic imaging experiments (n = 6 CD11b-HSVTK−/− and n = 4 CD11b-HSVTK+/−). Each animal underwent small animal imaging with 18FDG for 3 scans. Scan 1: Baseline, prior to any perturbation (white bars), Scan 2: Baseline with GCV pump, followed implantation with GCV mini pump (hatched bars), San 3: Pilocarpine, regional 18FDG uptake during acute seizures (black bars). ROI analysis developed from a standard template (Ma et al., 2005), with an additional ROI placed at the cortical region above the dorsal hippocampus associated with probe implant (Probe). The graph also shows significant differences in the striatum (STR), septum (SEP), hippocampus (HIPP, left and right combined), and thalamus (THA) for each genotype between scans 1, 2 and 3. B) The maximum score during each 5 min interval was plotted over time, data points represent the average score ± S.E.M. for each subset of animals (**p < 0.01, ***p < 0.001, two-way ANOVA, Bonferroni post-tests to compare replicate means). C) MRI reference template overlaid with voxel based analysis for neuronal activation during acute seizures. Activations in the septum, hippocampus, thalamus, midbrain, and cerebellum are observed. Arrows represent decreased uptake corresponding to the ipsilateral hippocampus. Thresholds for displayed images were set at p < 0.001, uncorrected and t-scores are represented by respective color scales. D) Detailed ROI analysis of the hippocampus for CD11b-HSVTK−/− (white bars) and CD11b-HSVTK+/− (black bars), ipsilateral and contralateral to GCV infusion. The percent increase in 18FDG uptake was measured between scan 2 and 3 to correspond to the SPM T-map displayed in ‘C’ (*, p < 0.05, **p<0.01, ***p<0.001, two-tailed t-test).
Figure 4
Figure 4. Activated microglia and LPS preconditioning modulate seizure threshold through the mossy fiber pathway
A) Schematic of experimental design in group VI representing ganciclovir (GCV) pump implantation at day −7, LPS pretreatment at day −1, pilocarpine induced seizures at day 0 (260 mg/kg), and tissue collection at day 3, for mice CD11b-HSVTK−/− (white bars) and CD11b-HSVTK+/− (black bars). B) Overall seizure scores were calculated by continuously monitoring acute effects of pilocarpine for 1 hour (the maximum score during 5 min intervals was listed for each animal over 60 minutes, then these twelve scores were averaged together and compared, t-test). C) Interval seizure scores are shown for both genotypes, the maximum score during each 5 min interval is plotted over time (Two-way ANOVA, Bonferroni post-tests). D) Quantification of Iba1 positive cells in both genotypes of mice in the CA1 and DG at day 3 (Two-way ANOVA, Bonferroni post-tests). Data in all graphs were plotted as average ± S.E.M., (*, p < 0.05, ** p < 0.01, *** p < 0.001). E) Representative sections of iba1 positive microglia/macrophages (green fluorescence) and nuclei (DAPI, scale bars, 50 μM). F) Zymography analysis for tPA activity following acute seizures, showing tPA activity present in the mossy fiber pathway at day 3 (600 μM scale bar). G) NPY immunoreactivity associated with neurite outgrowth in the CA3 on day 3 of CD11b-HSVTK+/− mice but not −/− (25 μM scale bar).

Similar articles

Cited by

References

    1. Akarsu ES, Ozdayi S, Algan E, Ulupinar F. The neuronal excitability time-dependently changes after lipopolysaccharide administration in mice: possible role of cyclooxygenase-2 induction. Epilepsy Res. 2006;71:181–7. - PubMed
    1. Altay EE, Fessler AJ, Gallagher M, Attarian HP, Dehdashti F, Vahle VJ, Ojemann J, Dowling JL, Gilliam FG. Correlation of severity of FDG-PET hypometabolism and interictal regional delta slowing in temporal lobe epilepsy. Epilepsia. 2005;46:573–6. - PubMed
    1. Arican N, Kaya M, Kalayci R, Uzun H, Ahishali B, Bilgic B, Elmas I, Kucuk M, Gurses C, Uzun M. Effects of lipopolysaccharide on blood-brain barrier permeability during pentylenetetrazole-induced epileptic seizures in rats. Life Sci. 2006;79:1–7. - PubMed
    1. Auvin S, Porta N, Nehlig A, Lecointe C, Vallee L, Bordet R. Inflammation in rat pups subjected to short hyperthermic seizures enhances brain long-term excitability. Epilepsy Res. 2009;86:124–30. - PubMed
    1. Balosso S, Ravizza T, Perego C, Peschon J, Campbell IL, De Simoni MG, Vezzani A. Tumor necrosis factor-alpha inhibits seizures in mice via p75 receptors. Ann Neurol. 2005;57:804–12. - PubMed

Publication types

MeSH terms