Review
. 2010 Jun 18;285(25):18961-6.
doi: 10.1074/jbc.R109.011932. Epub 2010 Apr 9.

Single-molecule force spectroscopy approach to enzyme catalysis

Affiliations
Review

Single-molecule force spectroscopy approach to enzyme catalysis

Jorge Alegre-Cebollada et al. J Biol Chem. .

Abstract

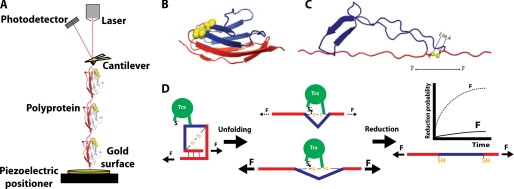
Enzyme catalysis has been traditionally studied using a diverse set of techniques such as bulk biochemistry, x-ray crystallography, and NMR. Recently, single-molecule force spectroscopy by atomic force microscopy has been used as a new tool to study the catalytic properties of an enzyme. In this approach, a mechanical force ranging up to hundreds of piconewtons is applied to the substrate of an enzymatic reaction, altering the conformational energy of the substrate-enzyme interactions during catalysis. From these measurements, the force dependence of an enzymatic reaction can be determined. The force dependence provides valuable new information about the dynamics of enzyme catalysis with sub-angstrom resolution, a feat unmatched by any other current technique. To date, single-molecule force spectroscopy has been applied to gain insight into the reduction of disulfide bonds by different enzymes of the thioredoxin family. This minireview aims to present a perspective on this new approach to study enzyme catalysis and to summarize the results that have already been obtained from it. Finally, the specific requirements that must be fulfilled to apply this new methodology to any other enzyme will be discussed.


Figures

FIGURE 1.
FIGURE 1.
Single-molecule force spectroscopy assay for the detection of single reduction events by the enzyme Trx. A, in the standard assay, (I27G32C-A75C)8 is stretched between the tip of an AFM cantilever and a gold surface. In the force-clamp mode, the signal received by the photodetector is kept constant by an electronic feedback system that controls the extension of the polyprotein via the piezoelectric positioner. Note that, for the sake of simplicity, only three monomers of the polyprotein are depicted in the diagram. B, shown is the I27 monomer, with the residues forming the disulfide bond indicated in yellow (Protein Data Bank code 1TIT). C, shown is the structure of one I27G32C-A75C module after unfolding according to molecular dynamics simulations (27). Because of the presence of the disulfide bond, only part of the protein unfolds (shown in red). D, as long as the modules remain folded, the disulfide bond in each I27G32C-A75C domain cannot be reduced by Trx. The unfolding event acts as a steric switch that allows the disulfide bond to be accommodated into the active site of Trx and be reduced. Concomitant to the reduction, a second length increase is detected, as the trapped residues extend (shown in blue). The probability of reduction drastically depends on the applied force as a consequence of the dynamics of enzyme and substrate during catalysis.
FIGURE 2.
FIGURE 2.
Single-molecule force spectroscopy as a probe to study chemical reactions and enzyme catalysis. A, when (I27G32C-A75C)8 is pulled at 165 pN, a series of 10.8-nm steps is detected, reflecting the rapid unfolding of the modules up to the disulfide bond (see inset). If a reducing agent such as the enzyme Trx is present in solution (red trace), a second series of 13.2-nm steps is detected. These correspond to the reduction of the disulfide bonds and the subsequent release of the residues from 32 to 75. No reduction happens if there is no reducing agent in the solution (blue trace). Note the sharp peaks in the force trace reflecting the fast response of the feedback system after the unfolding and reduction events. B, 15–50 traces as that shown in Fig. 2A are averaged per force, and a single exponential is fitted to each averaged trace (smooth line) to get the reduction rates (r). C, shown is the force dependence of the reduction rate for a small reducing agent (l-Cys, 12.5 mm; blue circles), human Trx (10 μm; red squares), and E. coli Trx (10 μm; green triangles). Error bars were obtained by bootstrapping methods (27). D, the diagram represents the energy landscape for the thiol/disulfide exchange reaction under force. The application of force reduces the activation energy by F·Δx. Force-clamp determinations indicate the distance to the transition state (Δx) with sub-angstrom resolution. E, the schematic shows the Trx-catalyzed reduction of a disulfide bond in a stretched polypeptide. To acquire the correct geometry for an Sn2 reaction, the substrate disulfide bond has to rotate by angle θ, which causes a contraction of the substrate against the pulling force. It has been hypothesized that this contraction is responsible for the negative Δx obtained in single-molecule force spectroscopy experiments (see text).

References

    1. Kraut D. A., Carroll K. S., Herschlag D. (2003) Annu. Rev. Biochem. 72, 517–571 - PubMed
    1. Benkovic S. J., Hammes-Schiffer S. (2003) Science 301, 1196–1202 - PubMed
    1. Jäckel C., Kast P., Hilvert D. (2008) Annu. Rev. Biophys. 37, 153–173 - PubMed
    1. Karplus M., McCammon J. A. (1983) Annu. Rev. Biochem. 52, 263–300 - PubMed
    1. Benkovic S. J., Hammes G. G., Hammes-Schiffer S. (2008) Biochemistry 47, 3317–3321 - PubMed

Publication types

LinkOut - more resources