. 2010 Jun;185(2):685-93.
doi: 10.1534/genetics.110.115766. Epub 2010 Apr 9.

The evolutionary dynamics of operon distributions in eukaryote genomes

Affiliations

The evolutionary dynamics of operon distributions in eukaryote genomes

Asher D Cutter et al. Genetics. 2010 Jun.

Abstract

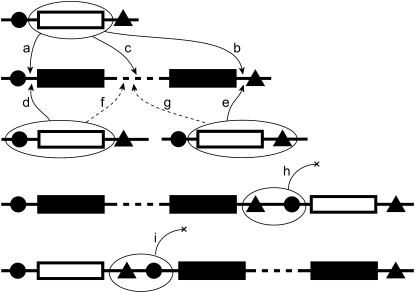
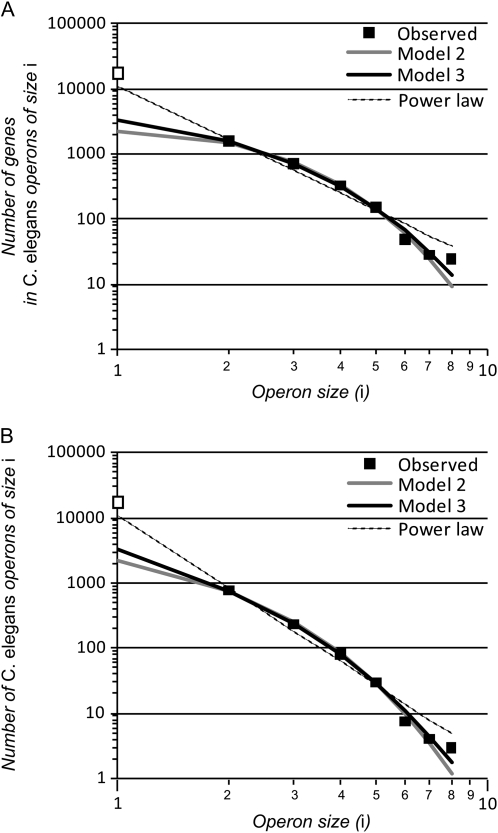
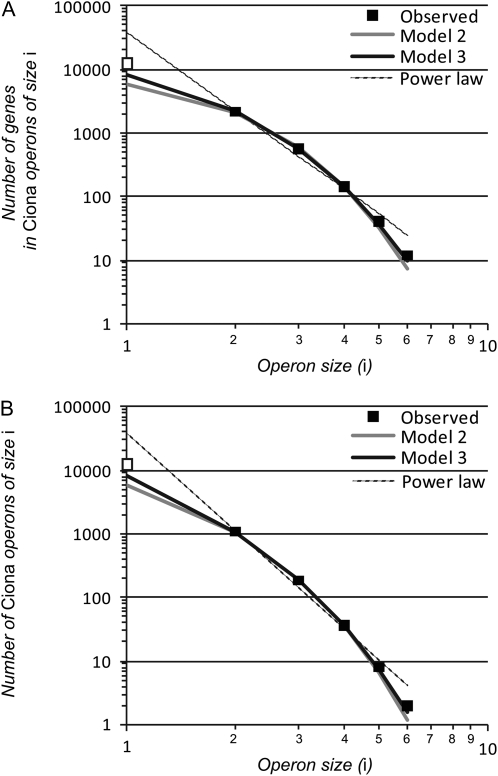
Genes in nematode and ascidian genomes frequently occur in operons--multiple genes sharing a common promoter to generate a polycistronic primary transcript--and such genes comprise 15-20% of the coding genome for Caenorhabditis elegans and Ciona intestinalis. Recent work in nematodes has demonstrated that the identity of genes within operons is highly conserved among species and that the unifying feature of genes within operons is that they are expressed in germline tissue. However, it is generally unknown what processes are responsible for generating the distribution of operon sizes across the genome, which are composed of up to eight genes per operon. Here we investigate several models for operon evolution to better understand their abundance, distribution of sizes, and evolutionary dynamics over time. We find that birth-death models of operon evolution reasonably describe the relative abundance of operons of different sizes in the C. elegans and Ciona genomes and generate predictions about the number of monocistronic, nonoperon genes that likely participate in the birth-death process. This theory, and applications to C. elegans and Ciona, motivates several new and testable hypotheses about eukaryote operon evolution.


Figures

F<sc>igure</sc> 1.—
Figure 1.—
A simple conception of mutational events leading to increased size of operons (solid rectangles represent genes within an operon). Translocation of monocistrons (open rectangles; a–g) or fusion via deletion of transcription termination and promoter elements (triangles and circles, respectively; h and i) between adjacent genes on the same strand could create or increase the size of an operon. Solid horizontal line represents noncoding DNA. For simplicity, we diagram only two genes in an operon; events of type a, b, d, e, or h involving only monocistrons would lead to the creation of a polycistronic operon. A dashed line represents DNA sequence between the first and last gene in an operon, in which additional gene members of the operon might reside. Also for simplicity, we diagram the enlargement of operons, although translocations f and g would result in the operon retaining the same number of genes or possibly decreasing in size. Conceivably, monocistrons in the diagram could be replaced by operons to increase operon size by more than one gene at a time; segmental duplication of operons also could generate changes in the abundance of an operon size class. Models 2 and 3 do not formally distinguish among these alternative mutational ways in which operon size could change. However, the models assume either that a single gene moves per time step or that genes move independently of one another. Consequently, these models do not capture fission–fusion events (paths h and i).
F<sc>igure</sc> 2.—
Figure 2.—
Model fits to C. elegans' operon size distribution in terms of the number of genes in a given operon size class (A) and for the number of operons of a given size (B). The “exact” solutions for models 2 and 3 were used in model fitting, although curves for approximate fits are indistinguishable by eye. Only operons containing two or more genes (solid squares) were used in model fitting.
F<sc>igure</sc> 3.—
Figure 3.—
Model fits to Ciona intestinalis' operon size distribution in terms of the number of genes in a given operon size class (A) and for the number of operons of a given size (B). The “exact” solutions for models 2 and 3 were used in model fitting, although curves for approximate fits are indistinguishable by eye. Only operons containing two or more genes (solid squares) were used in model fitting.

References

    1. Batista, P. J., J. G. Ruby, J. M. Claycomb, R. Chiang, N. Fahlgren et al., 2008. PRG-1 and 21U-RNAs interact to form the piRNA complex required for fertility in C. elegans. Mol. Cell 31 67–78. - PMC - PubMed
    1. Blumenthal, T., 2004. Operons in eukaryotes. Brief. Funct. Genomic. Proteomic. 3 199–211. - PubMed
    1. Blumenthal, T., and K. S. Gleason, 2003. Caenorhabditis elegans operons: form and function. Nat. Rev. Genet. 4 112–120. - PubMed
    1. Blumenthal, T., D. Evans, C. D. Link, A. Guffanti, D. Lawson et al., 2002. A global analysis of Caenorhabditis elegans operons. Nature 417 851–854. - PubMed
    1. Charlesworth, B., and C. H. Langley, 1989. The population-genetics of Drosophila transposable elements. Annu. Rev. Genet. 23 251–287. - PubMed