

Likelihood-free inference of population structure and local adaptation in a Bayesian hierarchical model
- PMID: 20382835
- PMCID: PMC2881139
- DOI: 10.1534/genetics.109.112391
Likelihood-free inference of population structure and local adaptation in a Bayesian hierarchical model
Abstract
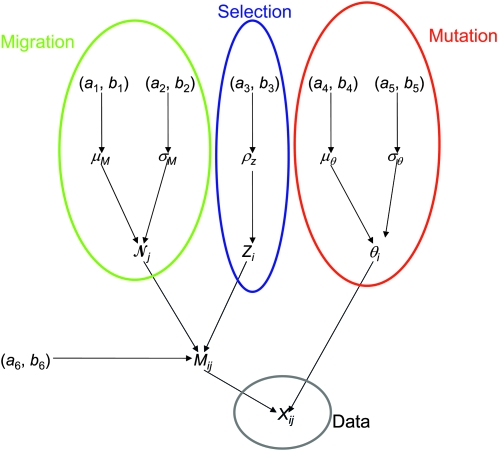
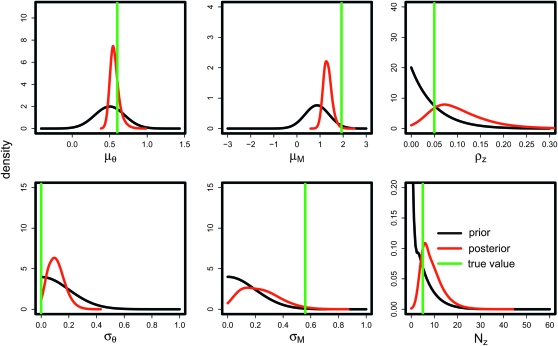
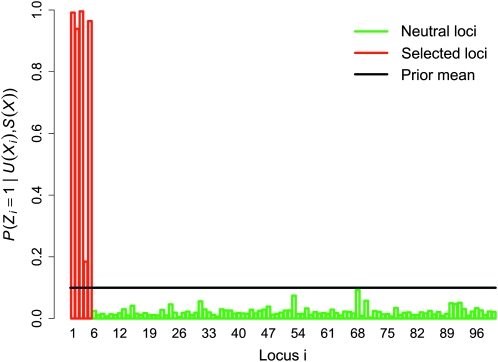
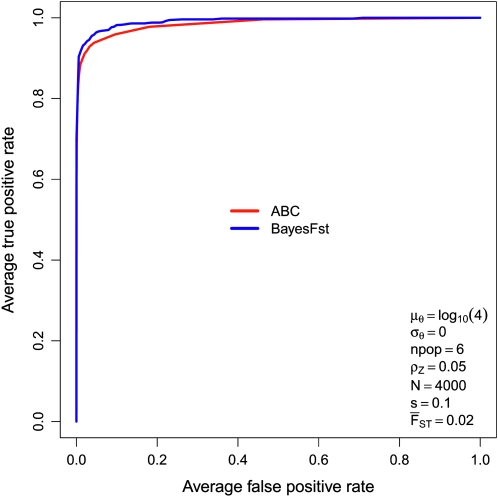
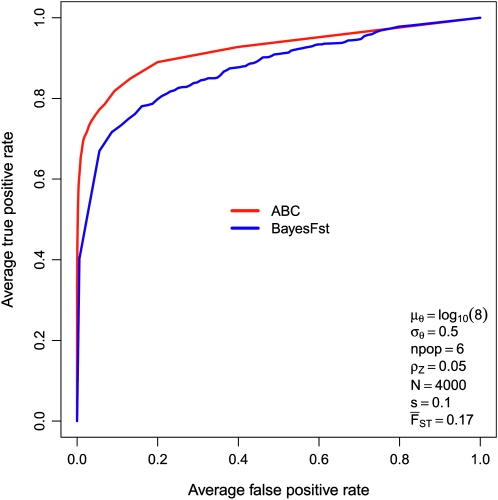
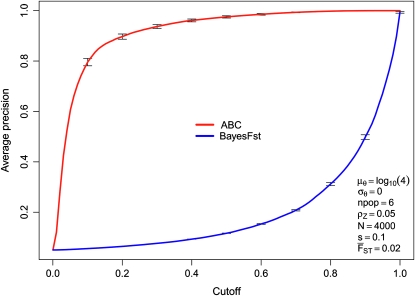
We address the problem of finding evidence of natural selection from genetic data, accounting for the confounding effects of demographic history. In the absence of natural selection, gene genealogies should all be sampled from the same underlying distribution, often approximated by a coalescent model. Selection at a particular locus will lead to a modified genealogy, and this motivates a number of recent approaches for detecting the effects of natural selection in the genome as "outliers" under some models. The demographic history of a population affects the sampling distribution of genealogies, and therefore the observed genotypes and the classification of outliers. Since we cannot see genealogies directly, we have to infer them from the observed data under some model of mutation and demography. Thus the accuracy of an outlier-based approach depends to a greater or a lesser extent on the uncertainty about the demographic and mutational model. A natural modeling framework for this type of problem is provided by Bayesian hierarchical models, in which parameters, such as mutation rates and selection coefficients, are allowed to vary across loci. It has proved quite difficult computationally to implement fully probabilistic genealogical models with complex demographies, and this has motivated the development of approximations such as approximate Bayesian computation (ABC). In ABC the data are compressed into summary statistics, and computation of the likelihood function is replaced by simulation of data under the model. In a hierarchical setting one may be interested both in hyperparameters and parameters, and there may be very many of the latter--for example, in a genetic model, these may be parameters describing each of many loci or populations. This poses a problem for ABC in that one then requires summary statistics for each locus, which, if used naively, leads to a consequent difficulty in conditional density estimation. We develop a general method for applying ABC to Bayesian hierarchical models, and we apply it to detect microsatellite loci influenced by local selection. We demonstrate using receiver operating characteristic (ROC) analysis that this approach has comparable performance to a full-likelihood method and outperforms it when mutation rates are variable across loci.
Figures
References
-
- Balding, D. J., 2003. Likelihood-based inference for genetic correlation coefficients. Theor. Popul. Biol. 63 221–230. - PubMed
-
- Balding, D. J., and R. A. Nichols, 1994. DNA profile match probability calculations: how to allow for population stratification, relatedness, database selection and single bands. Forensic Sci. Int. 64 125–140. - PubMed
-
- Barton, N., and B. Bengtsson, 1986. The barrier to genetic exchange between hybridising populations. Heredity 56 357–376. - PubMed
-
- Basu, D., 1977. On the elimination of nuisance parameters. J. Am. Stat. Assoc. 72 355–366.
-
- Beaumont, M., 2008. Selection and sticklebacks. Mol. Ecol. 17 3425–3427. - PubMed
Publication types
MeSH terms
Grants and funding
LinkOut - more resources
Full Text Sources
