

Activation becomes highly organized during long-duration ventricular fibrillation in canine hearts
- PMID: 20382862
- PMCID: PMC2886642
- DOI: 10.1152/ajpheart.01196.2009
Activation becomes highly organized during long-duration ventricular fibrillation in canine hearts
Abstract
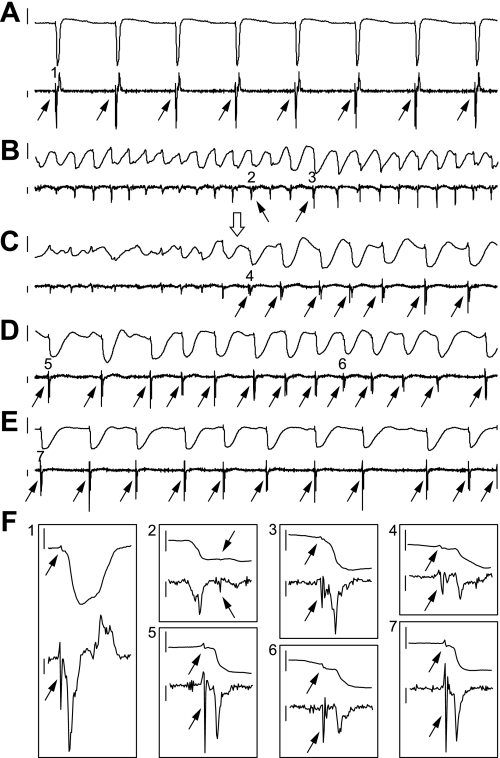
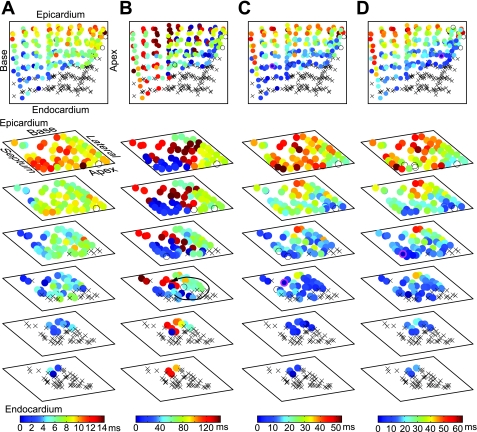
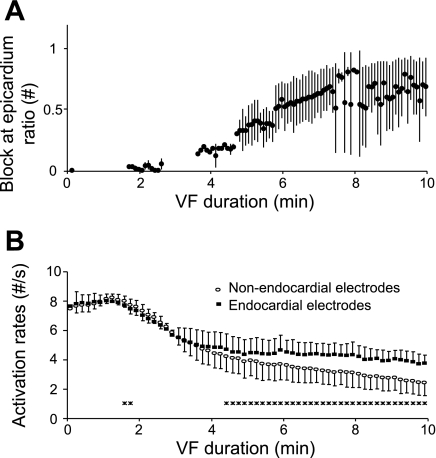
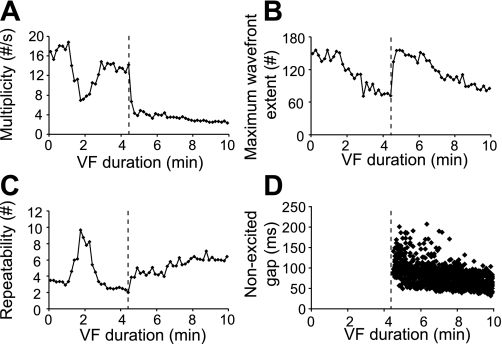
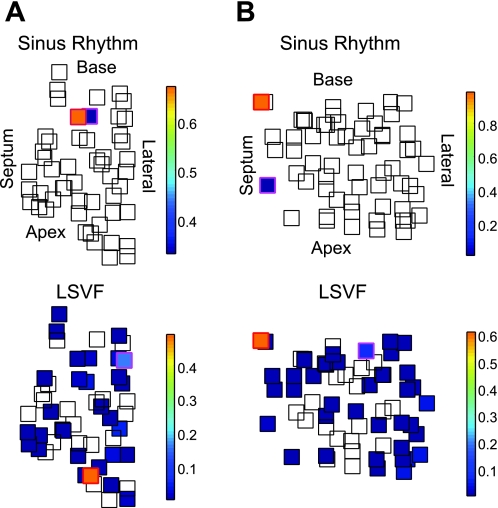
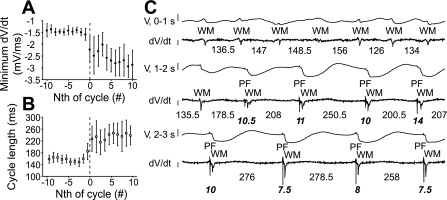
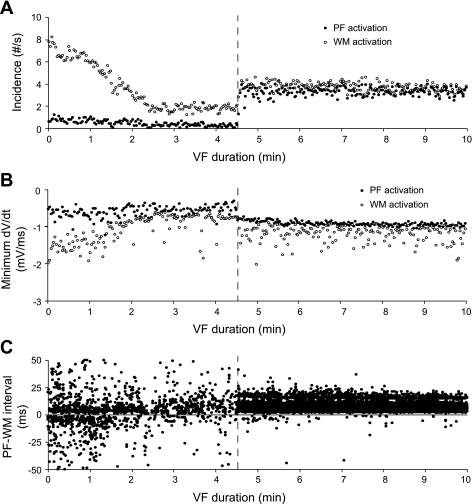
Little is known about the three-dimensional (3-D) intramural activation sequences during long-duration ventricular fibrillation (VF), including the role of the subendocardium and its Purkinje fibers (PFs) in long-duration VF maintenance. Our aim was to explore the mechanism of long-duration VF maintenance with 3-D electrical mapping. We recorded 10 min of electrically induced VF in the left ventricular anterior free wall of six 10-kg, open-chest dogs using a 3-D transmural unipolar electrode matrix (9 x 9 x 6, 2-mm spacing) that allowed us to map intramural activation sequences. At 2.5 + or - 1.8 min of VF, although the body surface ECG continued to exhibit a disorganized VF pattern, intramurally a more organized, synchronous activation pattern was first observed [locally synchronized VF (LSVF)]. This pattern occurred one or more times in all dogs and was present 33.4 + or - 31.4% of the time during 5-10 min of VF. As opposed to the preceding changing complex activation sequences of VF, during LSVF, wavefronts were large and highly repeatable near the endocardium, first exciting the endocardium almost simultaneously and then rapidly spreading toward the epicardium with different levels of conduction block en route. During LSVF, PF activations always preceded working myocardium activations near the endocardium. In conclusion, long-duration VF in dogs frequently becomes highly organized in the subendocardium, with activation fronts arising in this region and passing intramurally toward the epicardium, even though the surface ECG continues to exhibit a disorganized pattern. PFs appear to play an important role during this stage of VF.
Figures

Similar articles
-
Chemical ablation of the Purkinje system causes early termination and activation rate slowing of long-duration ventricular fibrillation in dogs.Am J Physiol Heart Circ Physiol. 2008 Aug;295(2):H883-9. doi: 10.1152/ajpheart.00466.2008. Epub 2008 Jun 27. Am J Physiol Heart Circ Physiol. 2008. PMID: 18586887 Free PMC article.
-
Activation patterns of Purkinje fibers during long-duration ventricular fibrillation in an isolated canine heart model.Circulation. 2007 Sep 4;116(10):1113-9. doi: 10.1161/CIRCULATIONAHA.107.699264. Epub 2007 Aug 13. Circulation. 2007. PMID: 17698730
-
Estimated global transmural distribution of activation rate and conduction block during porcine and canine ventricular fibrillation.Circ Res. 2004 Apr 2;94(6):836-42. doi: 10.1161/01.RES.0000120860.01645.17. Epub 2004 Feb 5. Circ Res. 2004. PMID: 14764451
-
Our search for the porcine mother rotor.Ann Noninvasive Electrocardiol. 2005 Oct;10(4 Suppl):7-15. doi: 10.1111/j.1542-474X.2005.00071.x. Ann Noninvasive Electrocardiol. 2005. PMID: 16274411 Free PMC article. Review.
-
Mechanisms of VF maintenance: wandering wavelets, mother rotors, or foci.Heart Rhythm. 2009 Mar;6(3):405-15. doi: 10.1016/j.hrthm.2008.11.005. Epub 2008 Nov 8. Heart Rhythm. 2009. PMID: 19251220 Free PMC article. Review.
Cited by
-
Endocardial focal activation originating from Purkinje fibers plays a role in the maintenance of long duration ventricular fibrillation.Croat Med J. 2014 Apr;55(2):121-7. doi: 10.3325/cmj.2014.55.121. Croat Med J. 2014. PMID: 24778098 Free PMC article.
-
Construction and validation of anisotropic and orthotropic ventricular geometries for quantitative predictive cardiac electrophysiology.Interface Focus. 2011 Feb 6;1(1):101-16. doi: 10.1098/rsfs.2010.0005. Epub 2010 Dec 3. Interface Focus. 2011. PMID: 22419977 Free PMC article.
-
Long-duration ventricular fibrillation exhibits 2 distinct organized states.Circ Arrhythm Electrophysiol. 2013 Dec;6(6):1192-9. doi: 10.1161/CIRCEP.113.000459. Epub 2013 Nov 15. Circ Arrhythm Electrophysiol. 2013. PMID: 24243784 Free PMC article.
-
Verapamil reduces incidence of reentry during ventricular fibrillation in pigs.Am J Physiol Heart Circ Physiol. 2014 Nov 1;307(9):H1361-9. doi: 10.1152/ajpheart.00256.2014. Epub 2014 Aug 29. Am J Physiol Heart Circ Physiol. 2014. PMID: 25172897 Free PMC article.
-
Endocardial Activation Drives Activation Patterns During Long-Duration Ventricular Fibrillation and Defibrillation.Circ Arrhythm Electrophysiol. 2017 Dec;10(12):e005562. doi: 10.1161/CIRCEP.117.005562. Circ Arrhythm Electrophysiol. 2017. PMID: 29247031 Free PMC article.
References
-
- Allison JS, Qin H, Dosdall DJ, Huang J, Newton JC, Allred JD, Smith WM, Ideker RE. The transmural activation sequence in porcine and canine left ventricle is markedly different during long-duration ventricular fibrillation. J Cardiovasc Electrophysiol 18: 1306–1312, 2007 - PubMed
-
- Bagdonas AA, Stuckey JH, Piera J, Amer NS, Hoffman BF. Effects of ischemia and hypoxia on the specialized conducting system of the canine heart. Am Heart J 61: 206–218, 1961 - PubMed
-
- Barnette AR, Bayly PV, Zhang S, Walcott GP, Ideker RE, Smith WM. Estimation of 3-D conduction velocity vector fields from cardiac mapping data. IEEE Trans Biomed Eng 47: 1027–1035, 2000 - PubMed
-
- Cha YM, Uchida T, Wolf PL, Peters BB, Fishbein MC, Karagueuzian HS, Chen PS. Effects of chemical subendocardial ablation on activation rate gradient during ventricular fibrillation. Am J Physiol Heart Circ Physiol 269: H1998–H2009, 1995 - PubMed
-
- Chattipakorn N, Fotuhi PC, Chattipakorn SC, Ideker RE. Three-dimensional mapping of earliest activation after near-threshold ventricular defibrillation shocks. J Cardiovasc Electrophysiol 14: 65–69, 2003 - PubMed
Publication types
MeSH terms
Grants and funding
LinkOut - more resources
Full Text Sources
Other Literature Sources
Research Materials