. 2010 Apr;66(Pt 4):339-51.
doi: 10.1107/S0907444910008656. Epub 2010 Mar 24.

Radiation damage in macromolecular crystallography: what is it and why should we care?

Affiliations

Radiation damage in macromolecular crystallography: what is it and why should we care?

Elspeth F Garman. Acta Crystallogr D Biol Crystallogr. 2010 Apr.

Abstract

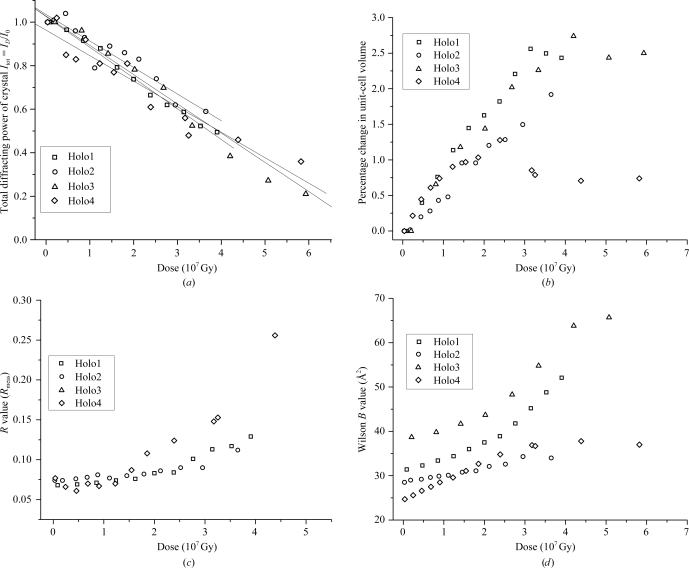
Radiation damage inflicted during diffraction data collection in macromolecular crystallography has re-emerged in the last decade as a major experimental and computational challenge, as even for crystals held at 100 K it can result in severe data-quality degradation and the appearance in solved structures of artefacts which affect biological interpretations. Here, the observable symptoms and basic physical processes involved in radiation damage are described and the concept of absorbed dose as the basic metric against which to monitor the experimentally observed changes is outlined. Investigations into radiation damage in macromolecular crystallography are ongoing and the number of studies is rapidly increasing. The current literature on the subject is compiled as a resource for the interested researcher.


Figures

Figure 1
Figure 1
Global radiation-damage indicators as a function of dose for four holoferritin crystals (Owen et al., 2006 ▶). (a) Mean I/mean I 0, (b) unit-cell volume, (c) R value and (d) Wilson B value.
Figure 2
Figure 2
Specific structural damage inflicted on a cryocooled crystal of apoferritin during sequential data sets collected on beamline ID14-4 at ESRF. (a) 2F o − F c map of Glu63 contoured at 0.2 e Å−3 after a dose of 2.5 MGy and (b) after 50 MGy. (c) 2F oF c map of Met96 contoured at 0.2 e Å−3 after a dose of 2.5 MGy and (d) after 50 MGy, showing loss of electron density around the disordered atoms (Garman & Owen, 2006 ▶).
Figure 3
Figure 3
Photograph of a 400 µm neuraminidase crystal (subtype N9 from avian influenza isolated from a noddy tern), space group I432, that has been irradiated on ID14-4 at the ESRF at 100 K and then allowed to warm up to RT. The three black marks are from the 100 × 100 µm beam; the discolouration is an indication of radiation damage.
Figure 4
Figure 4
An idealized plot of R d, the pairwise R factor between identical and symmetry-related reflections occurring on different diffraction images, plotted against the difference in dose, ΔD, between the images on which the reflections were collected (Diederichs, 2006 ▶). The plot is a straight line parallel to the x axis if there is no damage, but rises linearly in the presence of damage.
Figure 5
Figure 5
A plot of B rel (one value per data set collected on ID14-4 at the ESRF) against dose for two HEWL crystals, one native and the other cocrystallized with the scavengers ascorbate (Asc) and 1,4-benzoquinone (Quin). The solid lines represent linear fits to the data: the increase in B rel is only marginally slower with dose for the scavenger cocrystals, showing (when combined with an analysis of the resulting electron-density maps) that this particular combination is not effective in reducing the rate of damage (Southworth-Davies, 2008 ▶).
Figure 6
Figure 6
Illustration of radiation damage over a wide range of time scales and dose. Left, UV–vis absorption spectrum (blue, lowest; red, highest) of a cryocooled solution of cysteine, showing an intense peak at 400 nm corresponding to disulfide-anion radical production. The vertical bands arise from 1 s X-ray irradiations followed by 5–8 s of beam off, during which the 400 nm peak decays away (Southworth-Davies & Garman, 2007 ▶). Centre, F oF c difference density map (contoured at −2.5σ) of the Cys76–Cys94 bond in a HEWL structure calculated using the sixth data set in a sequential collection from one crystal (Murray & Garman, 2002 ▶). The bond is broken and the S atoms are delocalized. Right, decay of the normalized diffraction intensity of sequential data sets collected from four different holoferritin crystals (Owen et al., 2006 ▶). Figure modified from Owen, Pearson et al. (2009 ▶).
Figure 7
Figure 7
Primary X-ray interaction processes with the atoms of the crystal and solvent. (a) Elastic (Thomson, coherent) scattering. The waves are phase-shifted by 180° on scattering and add vectorially to give the diffraction pattern. (b) Compton (incoherent) scattering. The X-ray transfers some energy to an atomic electron and thus has lower energy (higher wavelength) after the interaction. Energy is lost in the crystal, contributing to the absorbed dose. (c) Photoelectric absorption. The X-ray transfers all its energy to an atomic electron, which is then ejected and can give rise to the ionization of up to 500 other atoms. The excited atom can then emit a characteristic X-ray or an Auger electron to return to its ground state.

References

    1. Adam, V., Carpentier, P., Violot, S., Lelimousin, M., Darnault, C., Nienhaus, G. U. & Bourgeois, D. (2009). J. Am. Chem. Soc.131, 18063–18065. - PubMed
    1. Adam, V., Royant, A., Nivière, V., Molina-Heredia, F. P. & Bourgeois, D. (2004). Structure, 12, 1729–1740. - PubMed
    1. Alcorn, T. & Juers, D. H. (2010). Acta Cryst. D66, 366–373. - PMC - PubMed
    1. Alphey, M. S., Gabrielsen, M., Micossi, E., Leonard, G. A., McSweeney, S. M., Ravelli, R. B., Tetaud, E., Fairlamb, A. H., Bond, C. S. & Hunter, W. N. (2003). J. Biol. Chem.278, 25919–29525. - PubMed
    1. Arndt, U. W. (1984). J. Appl. Cryst.17, 118–119.