. 2010 Apr;66(Pt 4):393-408.
doi: 10.1107/S0907444910007262. Epub 2010 Mar 24.

The minimum crystal size needed for a complete diffraction data set

Affiliations

The minimum crystal size needed for a complete diffraction data set

James M Holton et al. Acta Crystallogr D Biol Crystallogr. 2010 Apr.

Abstract

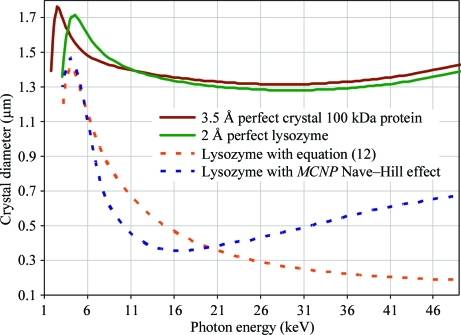
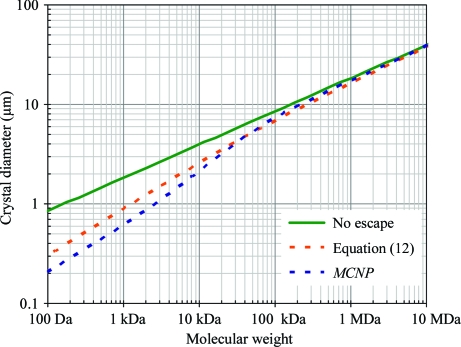
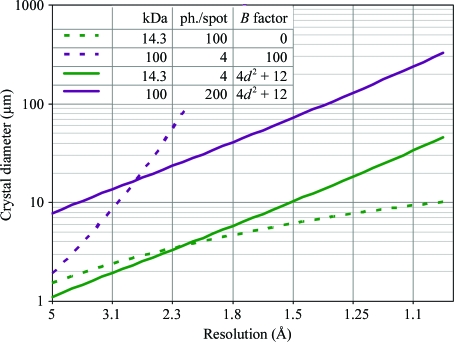
In this work, classic intensity formulae were united with an empirical spot-fading model in order to calculate the diameter of a spherical crystal that will scatter the required number of photons per spot at a desired resolution over the radiation-damage-limited lifetime. The influences of molecular weight, solvent content, Wilson B factor, X-ray wavelength and attenuation on scattering power and dose were all included. Taking the net photon count in a spot as the only source of noise, a complete data set with a signal-to-noise ratio of 2 at 2 A resolution was predicted to be attainable from a perfect lysozyme crystal sphere 1.2 microm in diameter and two different models of photoelectron escape reduced this to 0.5 or 0.34 microm. These represent 15-fold to 700-fold less scattering power than the smallest experimentally determined crystal size to date, but the gap was shown to be consistent with the background scattering level of the relevant experiment. These results suggest that reduction of background photons and diffraction spot size on the detector are the principal paths to improving crystallographic data quality beyond current limits.


Figures

Figure 1
Figure 1
Coordinate system. The x axis is occupied by the X-ray beam and the spindle rotates the crystal (at the origin) about the z axis. The y axis is not shown as it is very nearly perpendicular to the page. The reciprocal-lattice point (relp) of interest is described here by the circle it traces out as the crystal is rotated. Note that it intersects the Ewald sphere twice and that the ‘penetration speed’ is the component of the relp’s velocity that is perpendicular to the Ewald sphere surface. The ratio of the ‘actual speed’ to the ‘penetration speed’ is the Lorentz factor. The diffracted ray passes through the point of intersection, but evolves from the center of the Ewald sphere (not the origin!), which is an unfortunate conceptual flaw in Ewald’s construction. Nevertheless, the take-off angle (2θ) obtained is the same as that observed in real space. The angles α and κ used in (3) and Appendix C are shown.
Figure 2
Figure 2
Wavelength-dependence of the minimum required crystal size. All plotted calculations used V M = 2.4 Å3 Da−1, Wilson B = 0 and four photons/hkl in the indicated resolution bin. The crystal size required for 2 Å data from lysozyme and 3.5 Å data from a 100 kDa protein are essentially identical as these cases balance scattering power with data-quality requirements. Solid lines were calculated neglecting photoelectron escape (fNH = 1) and dotted lines represent two different models for photoelectron loss: that given by (12) (orange) and a full particle-tracking dose calculation with the program MCNP (blue). The sharp reversal of the curves at low energy is a consequence of the onset of backscattering, where the Lorentz factor spikes.
Figure 3
Figure 3
Radiation-damage model. The observations made by Owen et al. (2006 ▶) and Kmetko et al. (2006 ▶) are reproduced with permission from the original publishers and plotted against predicted curves derived from two alternative radiation-damage models. The ‘H model’ is an exponential decay of spot intensity with dose and the ‘B model’ is the dose-dependent B-factor model suggested by Kmetko et al. (2006 ▶). The ‘H model’ pre­dictions were made by applying (13) to intensities derived from the observed structure-factor file deposited with the indicated PDB entry and then computing the sum of all intensities (a) followed by scaling the ‘simulated damage’ intensities to the ‘zero-dose’ intensities (b) using the procedure described by Kmetko et al. (2006 ▶). The ‘B model’ prediction curves (dotted lines) were prepared similarly except that the ‘simulated damage’ intensities were generated by applying the relevant dose-dependent B factor reported by Kmetko et al. (2006 ▶). All ‘H model’ curves (solid lines) used the same value of H (10 MGy Å−1) and therefore may explain the dissimilar ‘sensitivity parameter’ observed by Kmetko et al. (2006 ▶) for apoferritin and lysozyme (orange circles versus blue squares, respectively). It is clear from (a) that the ‘B model’ is at odds with the observations of Owen et al. (2006 ▶) (green diamonds), although the same predicted intensities are in very good agreement with the data points from Kmetko et al. (2006 ▶) (orange circles). Agreement between these two studies is restored, however, if we accept the ‘H model’ where the resolution-dependence of radiation damage is exponential as opposed to a Gaussian (B model).
Figure 4
Figure 4
Molecular-weight dependence of the minimum required crystal size. All plotted calculations used V M = 2.4 Å3 Da−1, 1 Å radiation, 2 Å spots and B = 24 Å2. Without photoelectron escape, the required crystal volume is simply proportional to molecular weight and the two different models of photoelectron escape considered here are shown to have significant yet different effects for crystals smaller than a few micrometres wide, as this is the linear dimension of a photoelectron track (R PE).
Figure 5
Figure 5
Resolution-dependence of the minimum required crystal size. All plotted calculations used V M = 2.4 Å3 Da−1 and 1 Å radiation. The Wilson B factor strongly affects the curvature of the plot of the required crystal size for a given number of photons, but applying the empirical formula shown serendipitously simplifies this analysis, as described in the text.

References

    1. Afonine, P. V., Grosse-Kunstleve, R. W. & Adams, P. D. (2005). Acta Cryst. D61, 850–855. - PMC - PubMed
    1. Arndt, U. W. (1984). J. Appl. Cryst.17, 118–119.
    1. Arndt, U. W. & Wonacott, A. J. (1977). The Rotation Method in Crystallography. Amsterdam: North-Holland.
    1. Attix, F. H. (1986). Introduction to Radiological Physics and Radiation Dosimetry. New York: Wiley.
    1. Auger, P. (1925). J. Phys. Radium, 6, 205–208.

Publication types