

doi: 10.1038/nmeth.1452.
Epub 2010 Apr 11.
Using buoyant mass to measure the growth of single cells
Affiliations
- PMID: 20383132
- PMCID: PMC2862099
- DOI: 10.1038/nmeth.1452
Item in Clipboard
Using buoyant mass to measure the growth of single cells
Nat Methods.
2010 May.
Abstract
We used a suspended microchannel resonator (SMR) combined with picoliter-scale microfluidic control to measure buoyant mass and determine the 'instantaneous' growth rates of individual cells. The SMR measures mass with femtogram precision, allowing rapid determination of the growth rate in a fraction of a complete cell cycle. We found that for individual cells of Bacillus subtilis, Escherichia coli, Saccharomyces cerevisiae and mouse lymphoblasts, heavier cells grew faster than lighter cells.
Conflict of interest statement
COMPETING FINANCIAL INTEREST
The authors declare competing financial interests.
S.R.M. isaco-founder of Affinity Biosensors and declares competing financial interests.
Figures

Dynamic trapping of single cells. (a) Illustration of the suspended microchannel resonator (SMR) trapping a single cell. Embedded channel cross-sections for bacteria, yeast and mammalian L1210 mouse lymphoblasts are 3 × 8 microns, 8 × 8 microns, and 15 × 20 microns, respectively. The silicon walls are opaque except in the 15 × 20 microns device, which has thinner walls. (b) Schematic of fluidics: sample is injected in parallel through the left and right inlets (IL and IR) and collected at the left and right outlets (OL and OR). While trapping, IL, IR and OL are kept at the same constant pressure; variable pressure at OR applied by a computer controlled regulator determines the direction of fluid flow in the device. (c) Raw data showing 400 measurements of one B. subtilis cell’s buoyant mass. The frequency shift increase with time indicates cellular growth. inset Detail of a few peaks that show a locally stable baseline forms after each pass through the SMR, allowing for drift compensation. (d) Several B. subtilis cells were sequentially trapped. Each point represents the amplitude of the frequency shift, converted to buoyant mass, as the cell transits through the cantilever. Each set of points (e.g. from 0 to 12 minutes) is one single cell or non-segregated cells. Heavier cells have higher growth rates.

Growth rate versus initial buoyant mass. Each data point represents a trapped cell and is plotted on the diagram according to the cell’s initial buoyant mass and the measured growth rate during the trapping period. Filled circles indicate normal growing cells and open circles indicate fixed cells. (a) B. subtilis (Marburg strain) from 9 cultures grown at 37 °C. (b) E. coli K12 from 11 cultures grown at 37 °C. (c) S. cerevisiae from one culture grown at 30 °C. (d) L1210 mouse lymphoblasts from two cultures grown at 37 °C. Curve fits are weighted linear regressions. The growth rate errors bars for the growing cells are ± one standard deviation of the growth rate measurements of the fixed cells, except in the cases when the least squares fitting parameter standard error is greater (due to particularly short trapping times). See Online Methods and Supplementary Table 1 for details on culture growth conditions, statistical analysis and experimental errors. Supplementary Figure 6 shows a small, but non-zero, probability of over- or under-determining the growth rate. In light of this, the three L1210 cells that exhibited surprisingly high growth rates (circled in red) were not included in the linear regression.
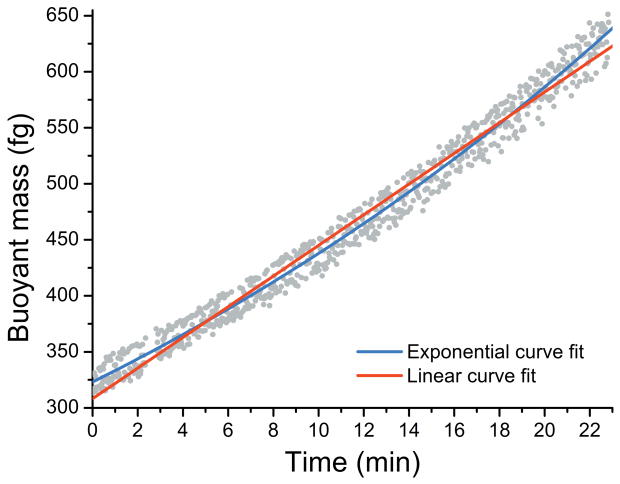
B. subtilis cell trapped for a period similar to the cell cycle duration. Data is fitted to linear (red; reduced χ2 = 0.00257) and exponential (blue; reduced χ2 = 0.00187) functions. See the Supplementary Note and Supplementary Table 4 for details of the statistical analysis, additional models and model comparison.
Comment in
-
Measuring the growth rate of cells, one at a time.Nat Methods. 2010 May;7(5):363. doi: 10.1038/nmeth0510-363. Nat Methods. 2010. PMID: 20431549 No abstract available.
References
Publication types
MeSH terms
Grants and funding
LinkOut - more resources
Full Text Sources
Other Literature Sources
Molecular Biology Databases
