. 2010 May;13(5):577-83.
doi: 10.1038/nn.2532. Epub 2010 Apr 11.

Real-time visualization of complexin during single exocytic events

Affiliations

Real-time visualization of complexin during single exocytic events

Seong J An et al. Nat Neurosci. 2010 May.

Abstract

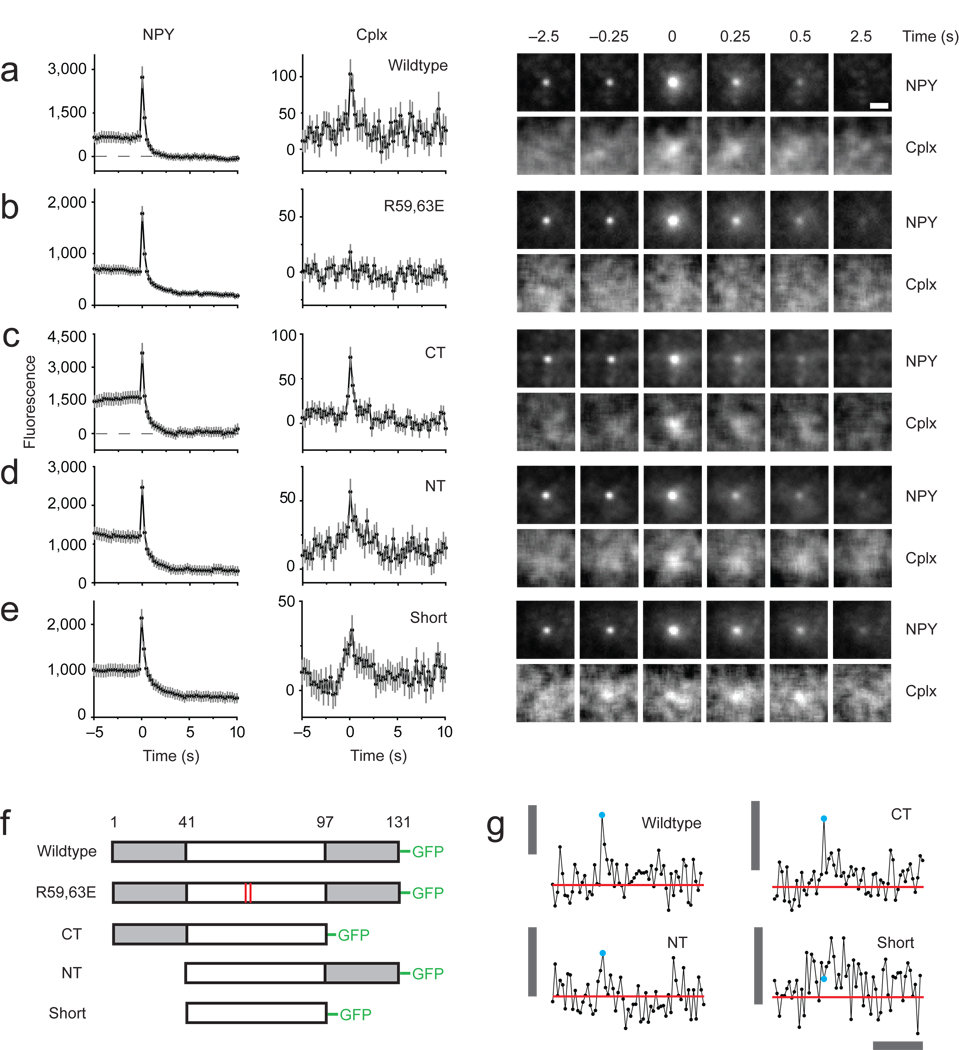
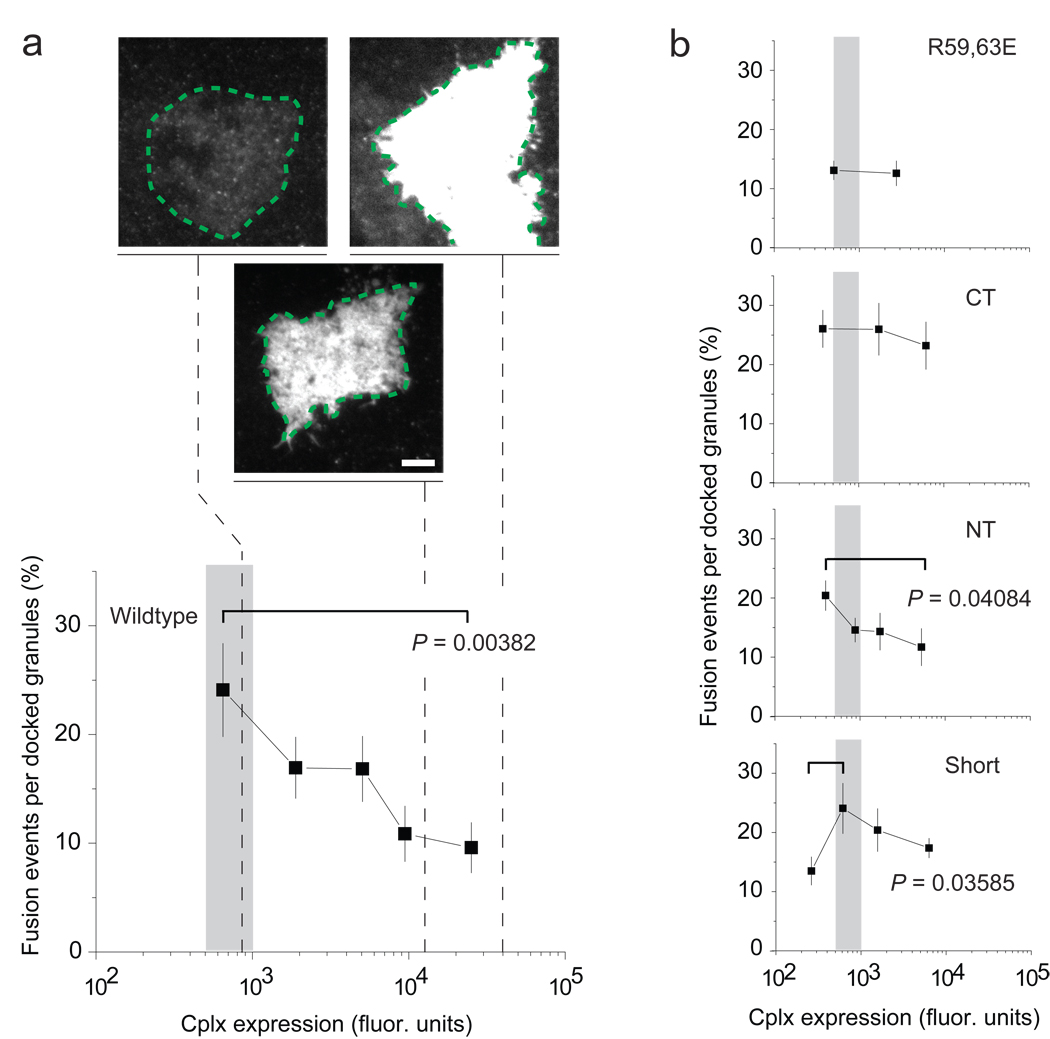
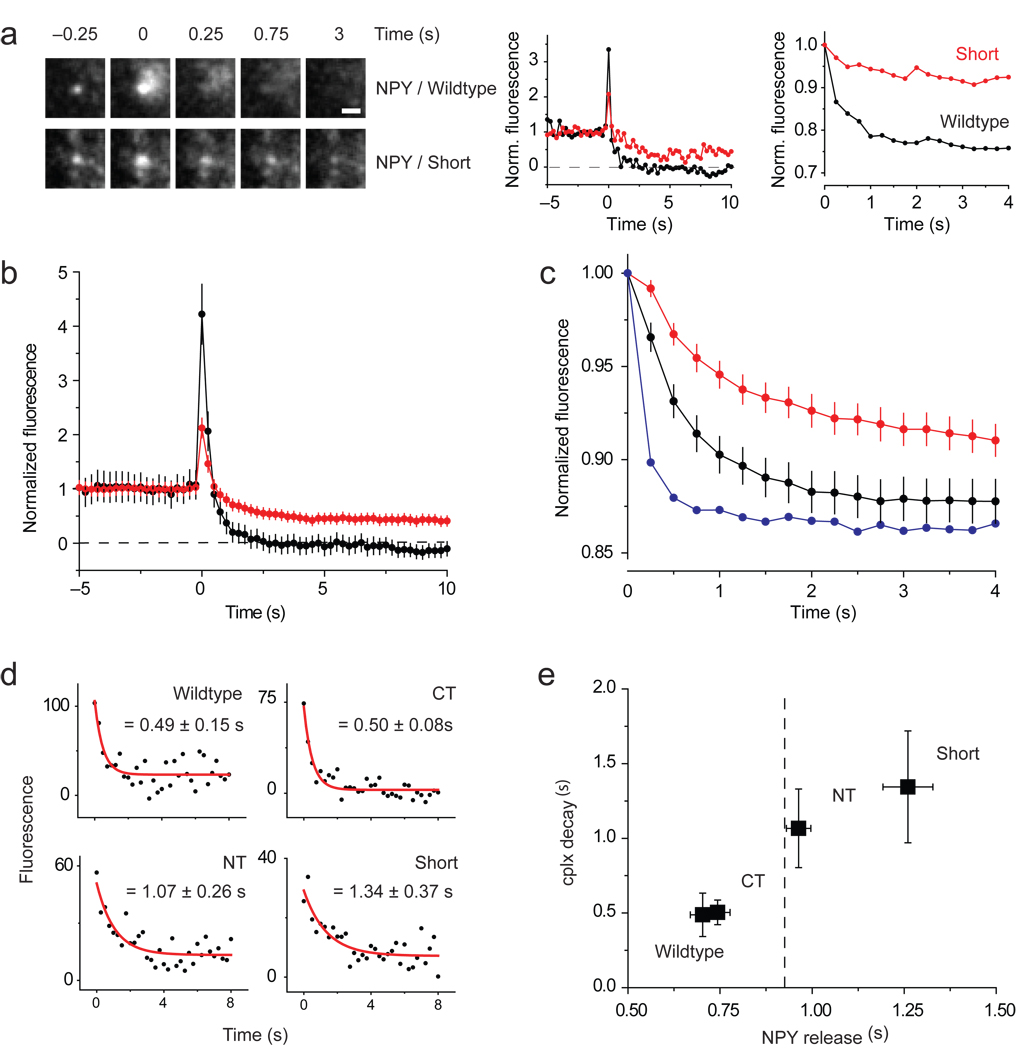
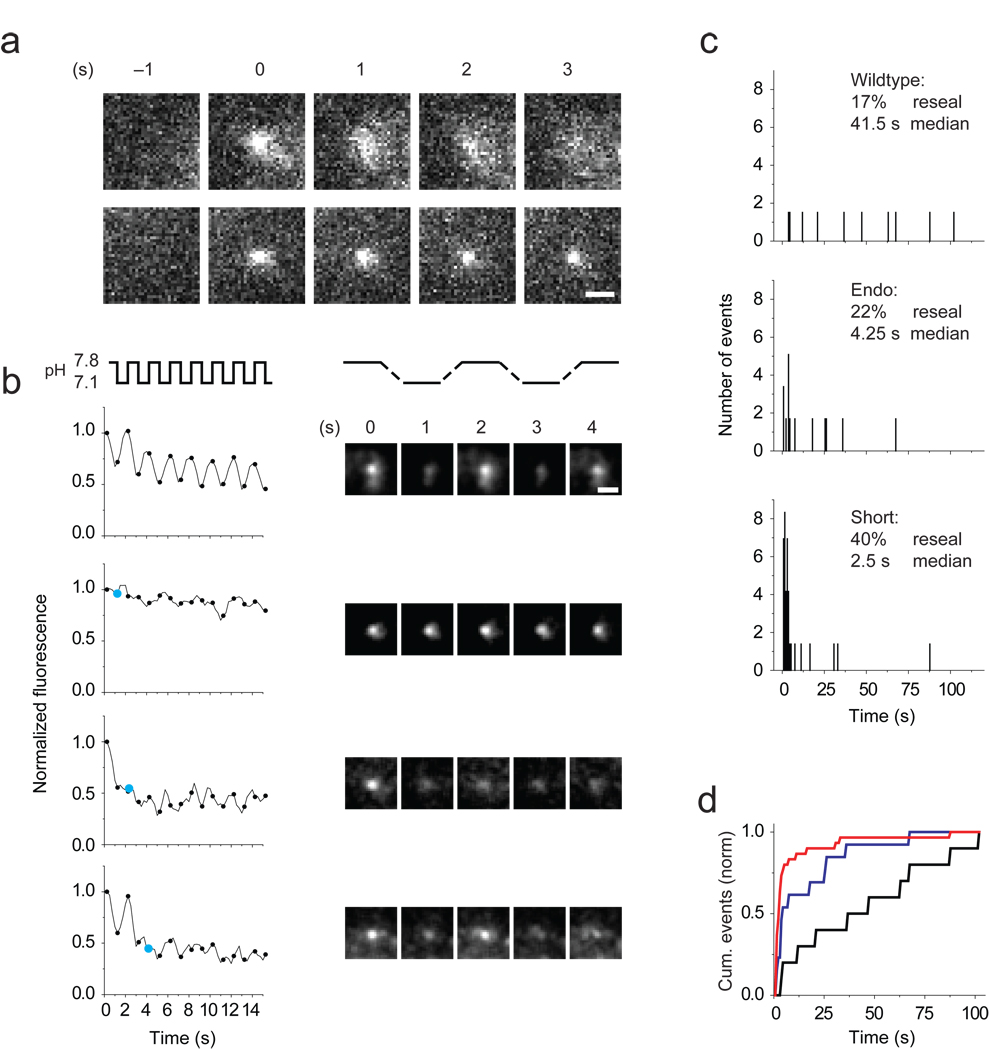
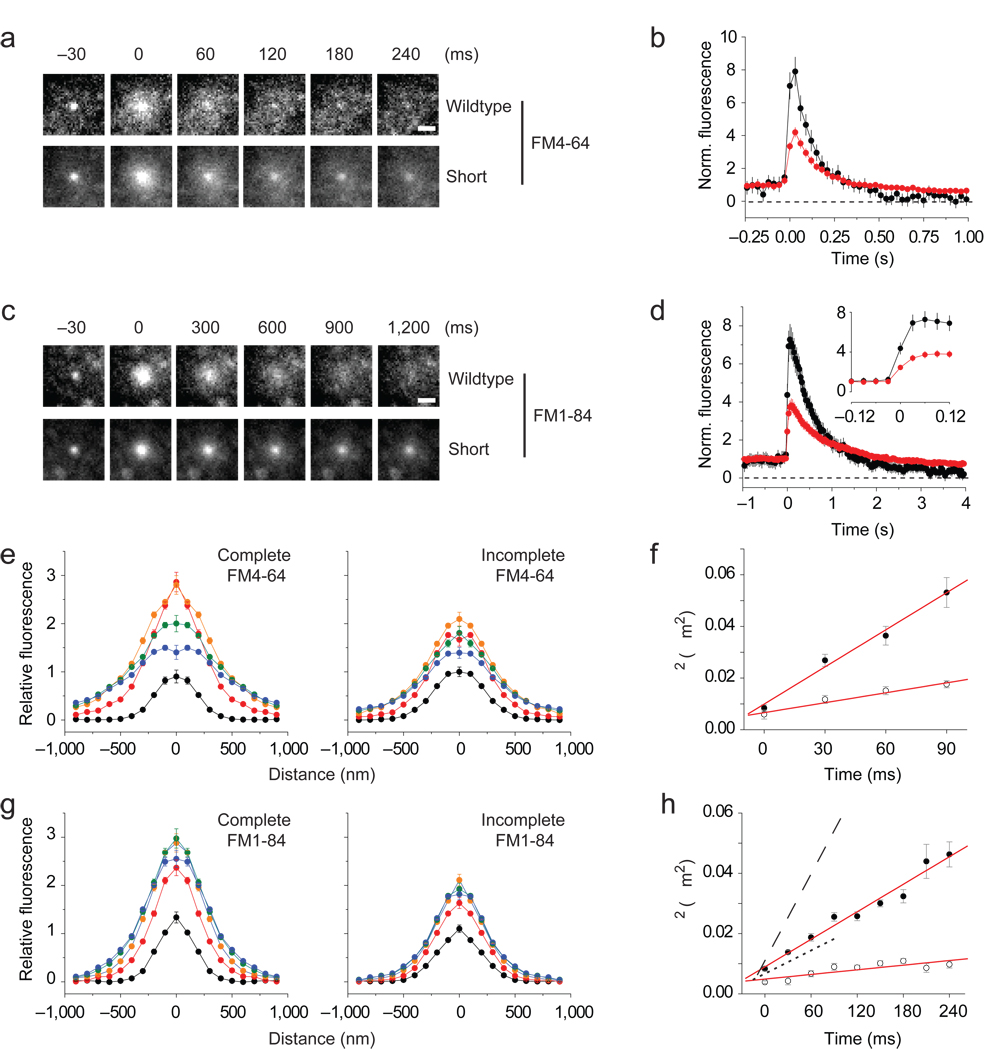
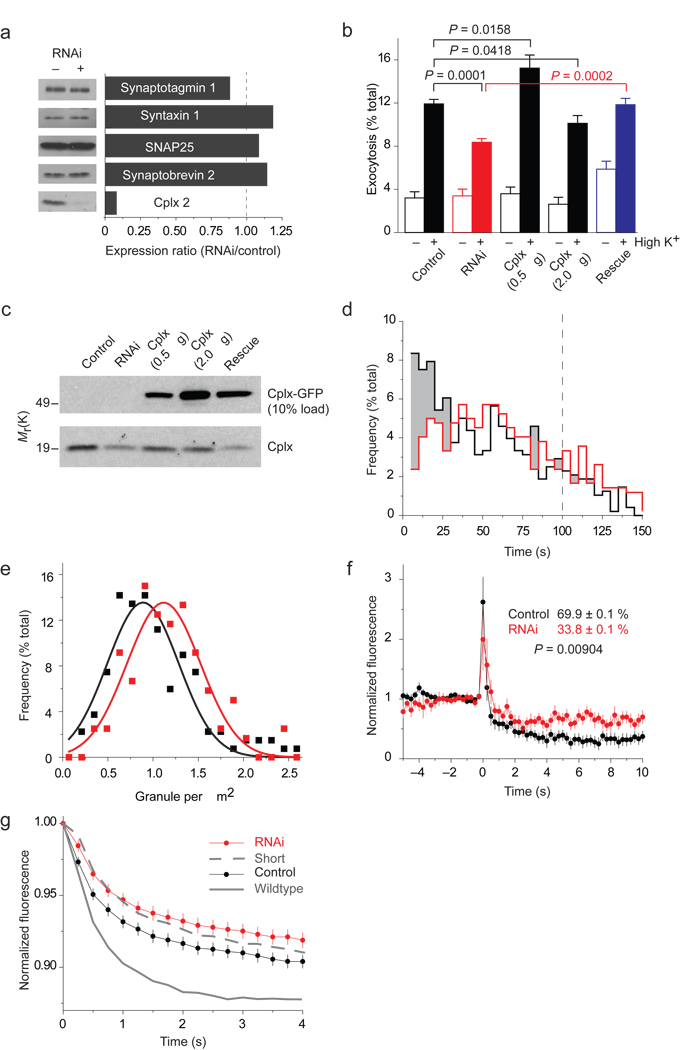
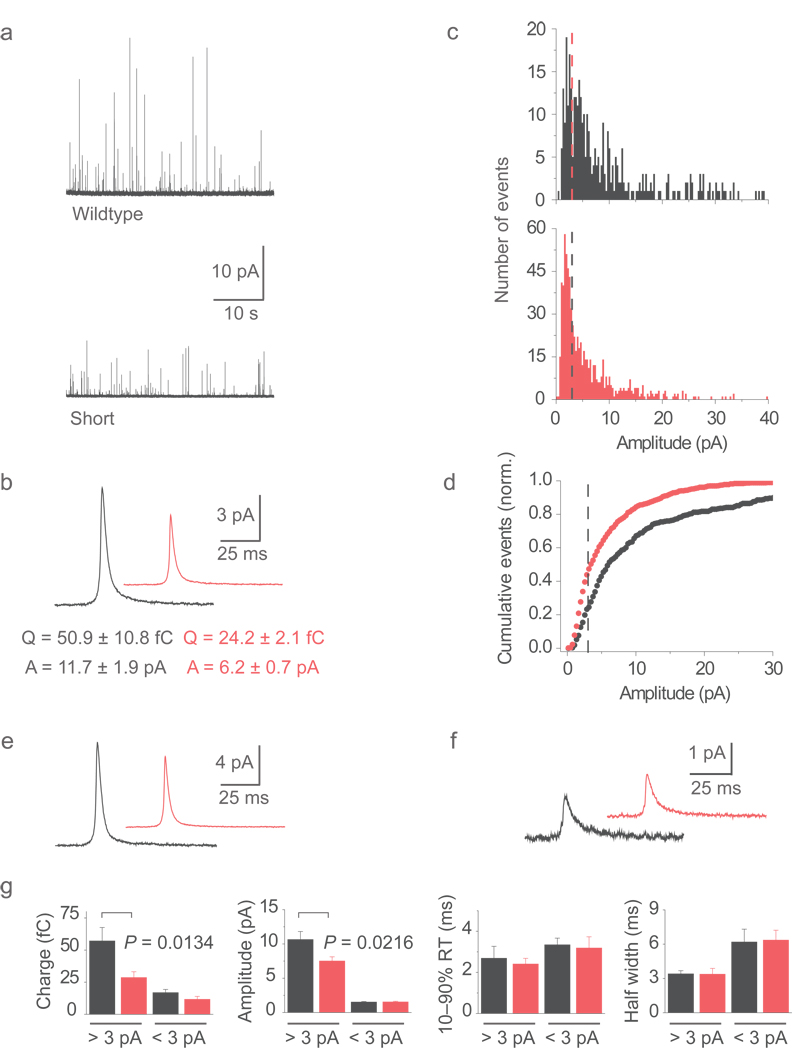
Understanding the fundamental role of soluble NSF attachment protein receptor (SNARE) complexes in membrane fusion requires knowledge of the spatiotemporal dynamics of their assembly. We visualized complexin (cplx), a cytosolic protein that binds assembled SNARE complexes, during single exocytic events in live cells. We found that cplx appeared briefly during full fusion. However, a truncated version of cplx containing only the SNARE-complex binding region persisted at fusion sites for seconds and caused fusion to be transient. Resealing pores with the mutant cplx only partially released transmitter and lipid probes, indicating that the pores are narrow and not purely lipidic in structure. Depletion of cplx similarly caused secretory cargo to be retained. These data suggest that cplx is recruited at a late step in exocytosis and modulates fusion pores composed of SNARE complexes.


Figures

Figure 1
Figure 1
Imaging secretory granules labeled with NPY-mRFP undergoing exocytosis in PC12 cells coexpressing different versions of cplx-GFP. (ae) Images (right) are averages of events time-aligned to the moment of fusion: wildtype (n = 94 events, 11 cells), R59,63E (n = 139 events, 16 cells), ΔCT (n = 85 events, 10 cells), ΔNT (n = 144 events, 18 cells), ‘short’ (n = 123 events, 12 cells). The fluorescence intensity (left) was calculated by taking the average intensity within a 1.2-µm circle centered on a granule, or the corresponding coordinates in the cplx channel, and subtracting the average intensity within a concentric 1.3-µm wide annulus, which served as the local background fluorescence; intensities were plotted against time and then averaged. Exocytosis was stimulated by perfusion with a solution of elevated [K+]. 3–6 transfections were performed per condition. Scale bar, 1 µm. Error bars are ± s.e.m. (f) Schematic diagram of cplx-GFP fusion proteins. (g) Examples of cplx-GFP signals associated with single fusion events. Cyan circle indicates when fusion occurred. Red line is the average intensity in the trace 3–5 s before fusion. Vertical bar, 200 fluorescence units; horizontal bar, 5 s.
Figure 2
Figure 2
Effect of cplx overexpression on NPY-mRFP exocytosis. (a) Plot of fusion events (% of docked granules) versus cplx expression level. The recording period was 3.33 min. The spatially averaged cplx-GFP fluorescence of the ‘footprint’ of the cell, where the cell adhered closely to the coverslip (green dashed lines), served as a measure of expression. The cplx expression levels of cells required for detecting SNARE complexes (see Fig. 1) fell within the range indicated by the shaded area (~500–1,000 fluorescence units). Representative footprints are shown at the same contrast setting to illustrate the differences in the brightness of transfected cells. Scale bar, 10 µm. (b) As in a, but for other cplx constructs. All points are the average of a 20-cell bin, except for the rightmost point in each plot, which represented the following number of cells: 17 (wildtype), 15 (R59,63E), 15 (ΔCT), 24 (ΔNT) and 18 (short). 3–8 transfections were performed per condition. Error bars are ± s.e.m. P values determined using a Student’s t-test.
Figure 3
Figure 3
Slow and incomplete release of NPY-mRFP when cplx persists during fusion. (a) Images (left) of granules releasing NPY-mRFP completely with wildtype cplx-GFP or incompletely with cplx short-GFP. Scale bar, 1 µm. (Middle) Background-subtracted fluorescence of same granules, normalized to the intensity during the last 2 s before fusion. (Right) Average fluorescence within larger, 2.5-µm–diameter circles centered over same granules, normalized to the intensity when fusion occurred. This ‘outer-circle’ fluorescence analysis is a better measure of the rate of NPY-mRFP release, since it minimizes diffusional loss outside of the region of interest. (b) Averages of background-subtracted NPY-mRFP fluorescence traces in Figure 1a,e normalized to pre-fusion intensity. Black trace, wildtype cplx-GFP; red trace, cplx short-GFP. The NPY-mRFP trace with cplx short-GFP is less noisy because it is an average of more events. (c) Averages of outer-circle NPY-mRFP fluorescence traces of the events in b normalized to initial-fusion intensity. Black trace, wildtype cplx-GFP; red trace, cplx short-GFP; blue trace, average of 5 events from wildtype cplx-GFP cells showing fastest loss of NPY-mRFP fluorescence, indicating that NPY-mRFP diffusion is unhindered within the space underneath the cell. (d) Averaged cplx-GFP signals (from Fig. 1) fitted to single exponential decay from fusion onset. (e) Plot of cplx-GFP decay times in d and rates of NPY-mRFP release measured with the outer circle fluorescence analysis in c. Dashed line, rate of NPY-mRFP release (0.93 ± 0.05 s) with the R59,63E-GFP mutant.
Figure 4
Figure 4
Rapid resealing of granules with persisting cplx. (a) Images (left) of granules labeled with tPA-phluorin spreading (top) or remaining compact (bottom) during exocytosis. Note that phluorin is completely acid-quenched at −1 s before fusion occurs. (b) Monitoring granule resealing by alternating the external pH once a second (4 frames). Plots of background-subtracted fluorescence of granules (left) once they become visible through exocytosis. For clarity, only time points marking the end of a pH pulse are shown (black circles), starting 750 ms after fusion. Events were plotted as rolling averages of three frames to reduce noise. In bottom three events, cyan circles mark the end of the pulse when resealing occurred. Image sequence (right) of the granules analyzed in the left plots. Scale bar, 1 µm. (c) Distribution of resealing times with wildtype cplx-mRFP (17% of 60 granules; median time 41.5 s), endogenous cplx (22% of 59; 4.25 s) and cplx short-mRFP (40% of 70; 2.5 s). For each condition, more than 10 cells in 2–4 transfections were analyzed. (d) Cumulative frequency distributions of resealing times. Black trace, wildtype cplx-mRFP; red trace, cplx short-mRFP; blue trace, endogenous cplx. P<0.001, Kolmogorov-Smirnov tests.
Figure 5
Figure 5
Restricted lateral diffusion of FM dyes with persisting cplx. (a) Averaged image sequence of FM4-64 release with wildtype cplx-GFP (n = 37 events, 7 cells) or cplx short-GFP (n = 78 events, 16 cells). The increase in fluorescence upon fusion is due to changes in the proximity of the dye to the glass interface, as well as changes in the dye’s orientation in the membrane. Scale bar, 1 µm. (b) Plots of background-subtracted FM4-64 fluorescence of granules, normalized to pre-fusion intensity. Black trace, wildtype cplx-GFP; red trace, cplx short-GFP. (c,d) As in a and b, but with FM1-84 (wildtype cplx-mRFP, n = 34 events, 8 cells; cplx short-mRFP, n = 105 events, 22 cells). Inset, traces shown at an expanded timescale. (e) Fluorescence profiles of averaged complete and incomplete FM4-64 release events at selected times relative to fusion (black circles, 30 ms; red circles, 0 ms; orange circles, 30 ms; green circles, 60 ms; blue circles, 90 ms). Images of analyzed events are shown in Supplementary Figure 11.(f). Timecourse of σ2, the square of the width of Gaussian curves (see Methods). The slope of each line corresponds to an apparent diffusion coefficient (solid circles: complete release, 0.45 µm2/s; open circles: incomplete release, 0.15 µm2/s). (g,h) As in e and f, but with FM1-84 (solid circles: complete release, 0.15 µm2/s; open circles: incomplete release, 0.03 µm2/s). For comparison, complete and incomplete timecourses of σ2 with FM4-64 are replotted as dashed and dotted lines, respectively.
Figure 6
Figure 6
NPY-mRFP exocytosis in cells depleted of cplx. (a) RNAi-mediated silencing of cplx expression. Cells cotransfected with GFP and a plasmid encoding short hairpin RNA (shRNA) targeting cplx 2 were isolated by fluorescence activated cell sorting and analyzed by immunoblotting. (b) Fluorimetric assay of NPY-mRFP released by cells after a 45-minute incubation at low or high [K+] (n = 15). In addition to 0.5 µg of NPY-mRFP plasmid (control), cells were transfected with 1 µg shRNA (RNAi), 0.5 or 2.0 µg cplx-GFP, or shRNA and 0.5 µg cplx-GFP plasmids (rescue). (c) Immunoblot analysis of the transfection conditions in b. (dg) TIRFM imaging of NPY-mRFP exocytosis. (d) Fusion latency of stimulus-evoked events in cells with (red, n = 419 events) or without shRNA (black, n = 480 events). Shading highlights wherever the frequency is lower with shRNA. Time is relative to start of stimulation, which lasted 100 s (dashed line). (e) Histogram of granule density in cells with (red) or without shRNA (black). The average density was 1.2 ± 0.5 and 1.0 ± 0.5 granules/µm2, respectively. (f) Background-subtracted fluorescence of granules undergoing exocytosis in cells with or without shRNA. Indicated extents of release (%) were based on cell averages calculated by subtracting the fluorescence 4–5 s after fusion from the intensity during the last 1 s before fusion. (g) Outer-circle fluorescence traces of the same events, averaged and normalized to initial-fusion intensity, in cells with or without shRNA. Rates with wildtype cplx-GFP and cplx short-GFP are replotted from Figure 3c.
Figure 7
Figure 7
Reduced transmitter release with persisting cplx. (a) Amperometric recordings of exocytosis from cells expressing wildtype cplx-GFP (upper) or cplx short-GFP (lower). (b) Averaged current spikes with wildtype cplx-GFP (n = 8 cells) cplx short-GFP (n = 12 cells). (c) Histograms of spike amplitudes with wildtype cplx-GFP (black) and cplx short-GFP (red). Dashed lines, 3 pA cutoff. (d) Distributions in c, plotted cumulatively and normalized to the total number of events. Dashed line, 3 pA cutoff. (e) Averaged current spikes of events above 3 pA from cells with wildtype cplx-GFP (black) or cplx short-GFP (red). (f) Averaged current spikes of events below 3 pA from cells with wildtype cplx-GFP (black) or cplx short-GFP (red). (g) Parameters of events above and below 3 pA with wildtype cplx-GFP (black) and cplx short-GFP (red).

Similar articles

Cited by

References

    1. Jahn R, Scheller RH. SNAREs—engines for membrane fusion. Nature Rev. Mol. Cell Biol. 2006;7:631–643. - PubMed
    1. Weber T, et al. SNAREpins: minimal machinery for membrane fusion. Cell. 1998;92:759–772. - PubMed
    1. Han X, Wang CT, Bai J, Chapman ER, Jackson MB. Transmembrane segments of syntaxin line the fusion pore of Ca2+-triggered exocytosis. Science. 2004;304:289–292. - PubMed
    1. Kesavan J, Borisovska M, Bruns D. v-SNARE actions during Ca2+-triggered exocytosis. Cell. 2007;131:351–363. - PubMed
    1. Jackson MB, Chapman ER. Fusion pores and fusion machines in Ca2+-triggered exocytosis. Annu. Rev. Biophys. Biomol. Struct. 2006;35:135–160. - PubMed

Publication types

MeSH terms