. 2010 May;11(5):442-8.
doi: 10.1038/ni.1860. Epub 2010 Apr 11.

The zinc-finger protein MAZR is part of the transcription factor network that controls the CD4 versus CD8 lineage fate of double-positive thymocytes

Affiliations

The zinc-finger protein MAZR is part of the transcription factor network that controls the CD4 versus CD8 lineage fate of double-positive thymocytes

Shinya Sakaguchi et al. Nat Immunol. 2010 May.

Abstract

The CD4 versus CD8 lineage specification of thymocytes is linked to coreceptor expression. The transcription factor MAZR has been identified as an important regulator of Cd8 expression. Here we show that variegated CD8 expression by loss of Cd8 enhancers was reverted in MAZR-deficient mice, which confirms that MAZR negatively regulates the Cd8 loci during the transition to the double-positive (DP) stage. Moreover, loss of MAZR led to partial redirection of major histocompatibility complex (MHC) class I-restricted thymocytes into CD4(+) helper-like T cells, which correlated with derepression of Th-POK, a central transcription factor for helper-lineage development. MAZR bound the silencer of the gene encoding Th-POK, which indicated direct regulation of this locus by MAZR. Thus, MAZR is part of the transcription factor network that regulates the CD8 lineage differentiation of DP thymocytes.


Figures

Figure 1
Figure 1
Altered CD4 to CD8 T cell ratio in the absence of MAZR. (a) Diagrams show thymocyte and splenocyte numbers of 6-8 weeks old Mazr+/+, Mazr+/− and Mazr−/− female mice. Each symbol represents one mouse, and horizontal lines indicate average values. (b) Flow cytometric analysis of CD4 and CD8α expression on thymocytes isolated from Mazr+/+ and Mazr−/− littermates. Cells were gated on total thymocytes (upper panel), or on CD3hi (middle panel) and on CD3lo (bottom panel) subsets. Numbers indicate the percentage of cells in the respective quadrant. Data are representative of more than 10 independent experiments. (c) CD4 and CD8α expression pattern on lymph node cells isolated from Mazr+/+ and Mazr−/− littermates. Cells were gated on the CD3+ population. Numbers in the dot plots indicate the percentage of cells in the respective quadrant. Data are representative of more than 10 independent experiments. (d) Diagrams show CD4 to CD8 ratio of SP thymocytes (left panel) and of CD3+ lymph node T cells (right panel) from Mazr+/+, Mazr+/− and Mazr−/− mice. Each symbol represents one mouse, and horizontal lines indicate average values.
Figure 2
Figure 2
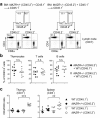
Reduced variegation of CD8 in E8I,E8II double-deficient mice in the absence of MAZR (a) CD4 and CD8α expression on CD45.2+ thymocytes isolated from Mazr+/+,E8I,E8II and Mazr−/−,E8 ,E8 + I II fetal liver (FL)-transplanted CD45.1 recipient mice (middle and right panel, respectively). Left panel shows thymic CD4 and CD8α expression profile of C57BL/6 mice. Cells were gated on total CD45.2+ thymocytes (upper panels), or on CD45.2+ CD3lo thymocytes (lower panels). Numbers indicate the percentage of cells in the respective quadrant. Data shown are representative of five mice each. (b) Diagram showing the percentage of CD4+CD8 (i.e. “CD8”) DP thymocytes within the CD45.2+CD3lo population in Mazr+/+,E8I,E8II and Mazr−/−,E8I,E8II FL-transplanted mice. Each dot represents one mouse, and horizontal lines indicate average values. The gating areas for CD4+CD8 cells is shown in a (lower panel).
Figure 3
Figure 3
T cell-intrinsic defects lead to an altered CD4 to CD8 ratio in Mazr−/− mice (a) Mazr+/+ (left panel) or Mazr−/− (right panel) BM (CD45.2+) was mixed in a 1:1 ratio with wild-type BM (CD45.1+) and injected into irradiated CD45.1+ recipients. Histograms show CD45.2 expression on CD3+ lymph node cells in BM chimeric mice. Numbers indicate the percentage of CD45.2 and CD45.2+ cells. Dot plots indicate CD4 and CD8α expression on CD45.2 and CD45.2+ lymph node T cells. Data are representative of 9 mice each. (b) Panels show the percentage of CD45.2+ thymocytes (left panel), T cells (CD3+ splenocytes; middle panel), and B cells (B220+ splenocytes; right panel) in BM chimeric mice. (c) Diagrams indicate CD4 to CD8 ratio in CD3hi thymocytes (left panel) and CD3+ splenocytes (right panel) in the CD45.1+ wild-type and CD45.2+ Mazr+/+ or CD45.2+ Mazr−/− subsets of BM chimeric mice. In b and c, each symbol represents one mouse, and horizontal lines indicate average value.
Figure 4
Figure 4
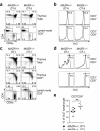
T cell development in MHC class I- and class II-restricted TCR transgenic mice in the absence of MAZR (a) CD4 and CD8 expression pattern on thymocytes and lymph node T cells isolated from Mazr+/+,OT-II and Mazr−/−,OT-II littermates. Numbers indicate the percentage of cells in the respective quadrants. Data are representative of 3 independent experiments. (b) Histograms show Vα2 expression on CD4+ and CD8+ lymph node T cells isolated from Mazr+/+,OT-II and Mazr−/−,OT-II littermates. Numbers show the percentage of Vα2hi cells within the indicated region. Gating areas for CD4+ and CD8+ T cell populations are shown in the lower panel of a. Data are representative of 3 independent experiments. (c) CD4 and CD8α expression on total (upper panel) and CD3hi (middle panel) thymocytes, and on lymph node T cells (lower panel) isolated from Mazr+/+,OT-I and Mazr−/−,OT-I littermates. Numbers indicate the percentage of cells in the respective quadrant. Data are representative of 7 independent experiments. (d) Histograms show Vα2 expression on CD4+ and CD8+ lymph node T cells isolated from Mazr+/+,OT-I and Mazr−/−,OT-I littermates. Numbers show the percentage of Vα2hi cells within the indicated region. Gating areas for CD4+ and CD8+ T cell populations are shown in the lower panel of c. Data shown are representative of 7 independent mice. (e) Panels showing the percentage of Vα2hi cells in CD4+ lymph node T cells isolated from Mazr+/+,OT-I and Mazr−/−,OT-I mice. Each symbol represents one mouse, and horizontal lines indicate average values.
Figure 5
Figure 5
Redirected differentiation of MHC class I-restricted thymocytes into helper lineage cells in the absence of MAZR. (a) CD4 and CD8α expression on lymph node T cells isolated from Mazr+/+Rag2−/−,OT-I and Mazr−/−Rag2−/−,OT-I fetal liver (FL)-transplanted mice. Cells were gated on the CD45.2+Vα2+ population. Numbers indicate the percentage of cells in the respective quadrants. Data are representative of 7 independent experiments. (b) Panels show CD45.2+Vα2+CD4+ and CD45.2+Vα2+CD8+ T cell numbers isolated from the spleens of Mazr+/+Rag2−/−,OT-I and Mazr−/−Rag2−/−,OT-I FL-transplanted mice. Each symbol represents one mouse, and horizontal lines indicate average values. (c) T cell-depleted BM cells from Mazr+/+ and Mazr−/− mice (CD45.2+) were transferred into MHC class II-deficient (H2-Ab1−/−, CD45.1+) recipient mice. Dot plots shows CD4 and CD8α expression pattern of CD45.2+ CD3+ T cells in the spleen of Mazr+/+ (left) and Mazr−/− (right) BM chimeric MHC class II-deficient mice. To exclude invariant NKT cells, CD1d:PBS57 tetramer-positive cells were excluded from the analysis. Data are representative of 10 independent experiments. (d) Diagrams show CD45.2+CD3+CD4+ and CD45.2+CD3+CD8+ T cell numbers isolated from the spleens of Mazr+/+ and Mazr−/− BM chimeric MHC class II-deficient (H2-Ab1−/−) mice. Each symbol represents one mouse, and horizontal lines indicate average values.
Figure 6
Figure 6
Derepression of ThPOK in Mazr−/−Rag2−/−,OT-I thymocytes and CD8+ T cells (a) Quantitative real-time PCR showing ThPOK expression in DP CD69 (DP 69), DP CD69+ (DP 69+), and CD4+CD8loCD69+ (4+8lo) thymocytes isolated from Mazr+/+Rag2−/−,OT-I (black bars) and Mazr−/−Rag2−/−,OT-I (white bars) FL-chimeric mice. As a reference, the expression of ThPOK in wild-type CD4SP (4S) and CD8SP (8S) thymocytes is shown at the right (gray bars). Values are relative to Hprt1 expression. ThPOK expression in Mazr+/+Rag2−/−,OT-I DP CD69 thymocytes is set as 1. Data are representative of 3 independent experiments (b) Histograms show GFP expression in DP CD69 (DP 69), DP CD69+ (DP 69+) and CD4+CD8loCD69+ (4+8lo69+) subsets, in CD4SP and CD8SP thymocytes, and in splenic CD4+ (4T) and CD8+ (8T) T cells. Gating areas are shown in Supplementary Fig. 8a. Upper and lower panels show thymocyte and splenocyte subsets analyzed from Mazr+/+ThPOK+/GFP,OT-I and from Mazr−/−ThPOK+/GFP,OT-I mice, respectively. Numbers show percentage of cells in the indicated region. Data are representative of 3 independent experiments.
Figure 7
Figure 7
Derepressed ThPOK expression in MHC class I-signaled Mazr−/− thymocytes (a) Histograms show GFP expression in DP CD69 (DP 69), DP CD69+ (DP 69+) and CD4+CD8loCD69+ (4+8lo69+) subsets, in CD4SP and CD8SP thymocytes, and in splenic CD4+ (4T) and CD8+ (8T) T cells. Gating areas are shown in Supplementary Fig. 8b. Upper and lower panels show thymocyte and splenocyte subsets analyzed from Mazr+/+ThPOK+/GFP and from Mazr−/−ThPOK+/GFP, respectively. Numbers show percentage of cells in the indicated regions. Data are representative of 5 independent experiments. (b) T cell-depleted BM cells from Mazr+/+ThPOK+/GFP and Mazr−/−ThPOK+/GFP mice were transferred into MHC class II-deficient (H2-Ab1−/−) or MHC class I-deficient (B2m−/−) recipient mice. Histograms show GFP expression in DP CD69+ (DP 69+) and CD4+CD8loCD69+ (4+8lo69+) thymocyte subsets of Mazr+/+ThPOK+/GFP (upper panels) and Mazr−/−ThPOK+/GFP (lower panels) BM chimeric MHC class II- (left) and MHC class I-deficient (right) mice. Gating areas are shown in Supplementary Fig. 8c. Numbers show percentage of cells in the indicated regions. Data are representative of 4 mice from 2 independent experiments. (c) Chromatin immunoprecipitation analysis of the ThPOK silencer. Mazr+/+ and Mazr−/− thymocytes chromatin was immunoprecipitated with anti-MAZR serum (Ab) or pre-serum (Pre), followed by PCR with primers specific for the ThPOK silencer region (Silencer) or for a non-MAZR binding region from the Cd8ab gene complex (Ctrl). Input DNA was PCR amplified undiluted or at a dilution of 1:5 or 1:25 (wedges) to ensure PCR quantification in a non-saturated amplification range. Data are representative of three independent experiments.

Comment in

Similar articles

Cited by

References

    1. Bosselut R. CD4/CD8-lineage differentiation in the thymus: from nuclear effectors to membrane signals. Nat Rev Immunol. 2004;4:529–540. - PubMed
    1. He X, Kappes DJ. CD4/CD8 lineage commitment: light at the end of the tunnel? Curr Opin Immunol. 2006;18:135–142. - PubMed
    1. Singer A, Adoro S, Park JH. Lineage fate and intense debate: myths, models and mechanisms of CD4- versus CD8-lineage choice. Nat Rev Immunol. 2008;8:788–801. - PMC - PubMed
    1. Ellmeier W, Sawada S, Littman DR. The regulation of CD4 and CD8 coreceptor gene expression during T cell development. Annu Rev Immunol. 1999;17:523–554. - PubMed
    1. Kioussis D, Ellmeier W. Chromatin and CD4, CD8A and CD8B gene expression during thymic differentiation. Nat Rev Immunol. 2002;2:909–919. - PubMed

MeSH terms