

The quantitative potential for breast tomosynthesis imaging
- PMID: 20384236
- PMCID: PMC2833185
- DOI: 10.1118/1.3285038
The quantitative potential for breast tomosynthesis imaging
Abstract
Purpose: Due to its limited angular scan range, breast tomosynthesis has lower resolution in the depth direction, which may limit its accuracy in quantifying tissue density. This study assesses the quantitative potential of breast tomosynthesis using relatively simple reconstruction and image processing algorithms. This quantitation could allow improved characterization of lesions as well as image processing to present tomosynthesis images with the familiar appearance of mammography by preserving more low-frequency information.
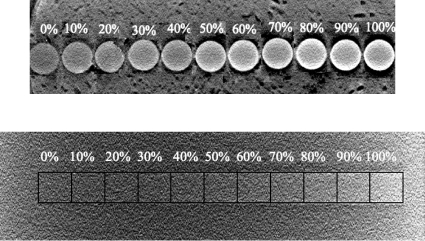
Methods: All studies were based on a Siemens prototype MAMMOMAT Novation TOMO breast tomo system with a 45 degrees total angular span. This investigation was performed using both simulations and empirical measurements. Monte Carlo simulations were conducted using the breast tomosynthesis geometry and tissue-equivalent, uniform, voxelized phantoms with cuboid lesions of varying density embedded within. Empirical studies were then performed using tissue-equivalent plastic phantoms which were imaged on the actual prototype system. The material surrounding the lesions was set to either fat-equivalent or glandular-equivalent plastic. From the simulation experiments, the effects of scatter, lesion depth, and background material density were studied. The empirical experiments studied the effects of lesion depth, background material density, x-ray tube energy, and exposure level. Additionally, the proposed analysis methods were independently evaluated using a commercially available QA breast phantom (CIRS Model 11A). All image reconstruction was performed with a filtered backprojection algorithm. Reconstructed voxel values within each slice were corrected to reduce background nonuniformities.
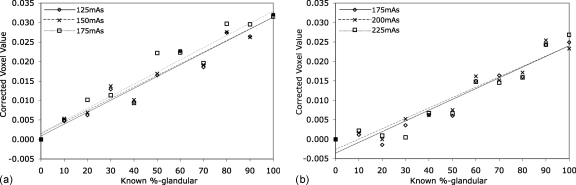
Results: The resulting lesion voxel values varied linearly with known glandular fraction (correlation coefficient R2 > 0.90) under all simulated and empirical conditions, including for the independent tests with the QA phantom. Analysis of variance performed on the fit line parameters revealed statistically significant differences between the two different background materials and between 28 kVp and the remaining energies (26, 30, and 32 kVp) for the dense experimental phantom. How ever, no significant differences arose between different energies for the fatty phantom, nor for any of the many other combinations of parameters.
Conclusions: These strong linear relationships suggest that breast tomosynthesis image voxel values, after being corrected by our outlined methods, are highly positively correlated with true tissue density. This consistent linearity implies that breast tomosynthesis imaging indeed has potential to be quantitative.
Figures


Similar articles
-
Implementation and evaluation of an expectation maximization reconstruction algorithm for gamma emission breast tomosynthesis.Med Phys. 2012 Dec;39(12):7580-92. doi: 10.1118/1.4764480. Med Phys. 2012. PMID: 23231306 Free PMC article.
-
A computer simulation study comparing lesion detection accuracy with digital mammography, breast tomosynthesis, and cone-beam CT breast imaging.Med Phys. 2006 Apr;33(4):1041-52. doi: 10.1118/1.2174127. Med Phys. 2006. PMID: 16696481
-
Evaluation of scatter effects on image quality for breast tomosynthesis.Med Phys. 2009 Oct;36(10):4425-32. doi: 10.1118/1.3215926. Med Phys. 2009. PMID: 19928073 Free PMC article.
-
Evaluation of back projection methods for breast tomosynthesis image reconstruction.J Digit Imaging. 2015 Jun;28(3):338-45. doi: 10.1007/s10278-014-9736-6. J Digit Imaging. 2015. PMID: 25384538 Free PMC article. Review.
-
Digital tomosynthesis: technique.Radiol Clin North Am. 2014 May;52(3):489-97. doi: 10.1016/j.rcl.2014.01.003. Radiol Clin North Am. 2014. PMID: 24792651 Review.
Cited by
-
Correlation of free-response and receiver-operating-characteristic area-under-the-curve estimates: results from independently conducted FROC∕ROC studies in mammography.Med Phys. 2012 Oct;39(10):5917-29. doi: 10.1118/1.4747262. Med Phys. 2012. PMID: 23039631 Free PMC article.
-
A digital x-ray tomosynthesis coupled near infrared spectral tomography system for dual-modality breast imaging.Opt Express. 2012 Aug 13;20(17):19125-36. doi: 10.1364/OE.20.019125. Opt Express. 2012. PMID: 23038553 Free PMC article.
-
A review of breast tomosynthesis. Part II. Image reconstruction, processing and analysis, and advanced applications.Med Phys. 2013 Jan;40(1):014302. doi: 10.1118/1.4770281. Med Phys. 2013. PMID: 23298127 Free PMC article. Review.
-
Model predictions for the wide-angle x-ray scatter signals of healthy and malignant breast duct biopsies.J Med Imaging (Bellingham). 2015 Oct;2(4):043502. doi: 10.1117/1.JMI.2.4.043502. Epub 2015 Oct 23. J Med Imaging (Bellingham). 2015. PMID: 26835493 Free PMC article.
-
Generation of a suite of 3D computer-generated breast phantoms from a limited set of human subject data.Med Phys. 2013 Apr;40(4):043703. doi: 10.1118/1.4794924. Med Phys. 2013. PMID: 23556929 Free PMC article.
References
-
- US Preventive Services Task Force, “Screening for breast cancer: Recommendations and rationale,” Ann. Intern Med. ZZZZZZ 137, 344–346 (2002). - PubMed
-
- Ning R., Conover D. L., Chen B., Schiffhauer L., Cullinan J., Ning Y., and Robinson A. E., “Flat-panel-detector-based cone-beam volume CT breast imaging: Phantom and specimen study,” Proc. SPIE PSISDG4682, 218–227 (2002).10.1117/12.465562 - DOI
Publication types
MeSH terms
Grants and funding
LinkOut - more resources
Full Text Sources
Medical
