

Vibratory sources as compound stimuli for the octavolateralis systems: dissection of specific stimulation channels using multiple behavioral approaches
- PMID: 20384404
- PMCID: PMC2854557
- DOI: 10.1037/a0016747
Vibratory sources as compound stimuli for the octavolateralis systems: dissection of specific stimulation channels using multiple behavioral approaches
Abstract
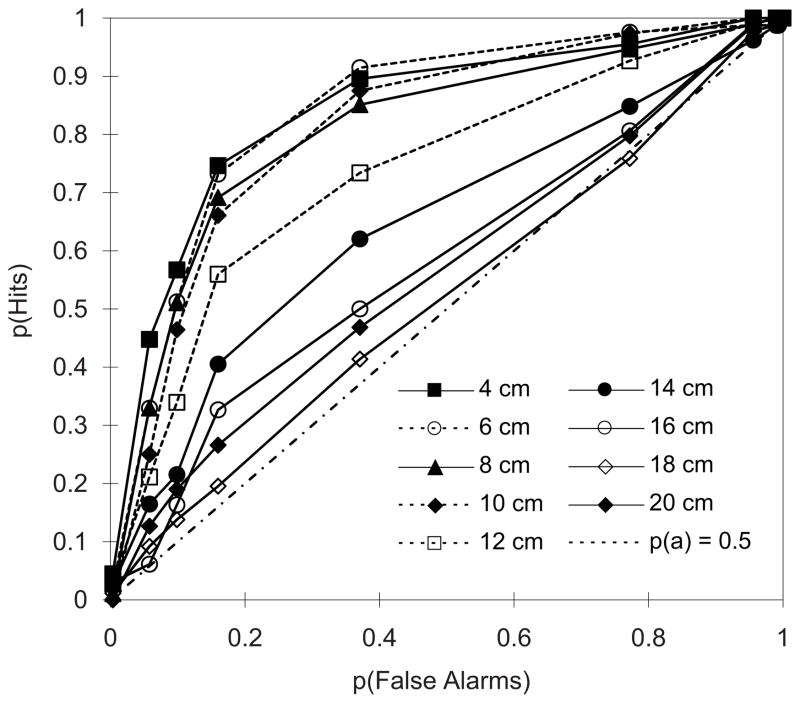
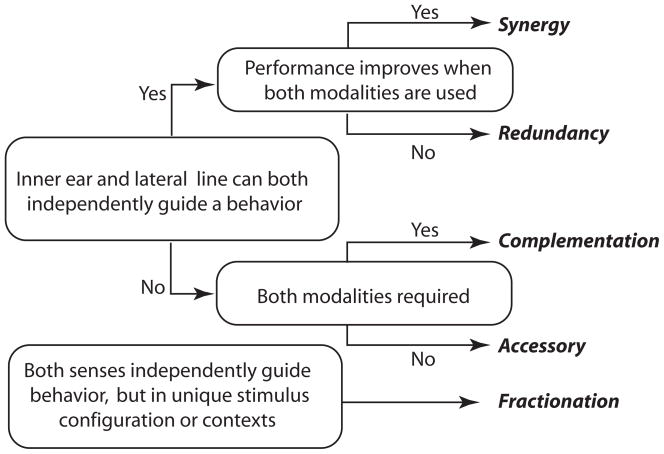
Underwater vibratory sources simultaneously present acoustic and hydrodynamic disturbances. Because vibratory dipole sources are poor sonic projectors, most researchers have assumed that such sources are of greatest relevance to the lateral line system. Both hydroacoustic principles and empirical studies have shown that dipole sources are also a potent stimulus to the inner ear. Responses to vibratory sources in mottled sculpin (Cottus bairdi) were assessed using unconditioned orienting, differential and nondifferential conditioning. Orienting responses are dominated by lateral line inputs and eliminated by lateral line inactivation. Simple conditioning depends on inputs from other systems and was not affected by lateral line inactivation. Differential conditioning alters behavioral control, and sculpin could be conditioned to ignore substrate-borne vibrations and respond only to hydroacoustic stimulation of the ear. The lateral line and inner ear of mottled sculpin do not necessarily exhibit range fractionation, as both systems operate over a similar distance (within 1.5 body lengths) and respond to many of the same sources. Vibratory dipole sources generate compound stimuli that simultaneously activate multiple octavolateralis systems, and sculpin make use of the channels differentially under different behavioral tasks.
Figures


Similar articles
-
Perception of frequency, amplitude, and azimuth of a vibratory dipole source by the octavolateralis system of goldfish (Carassius auratus).J Comp Psychol. 2011 Aug;125(3):286-95. doi: 10.1037/a0023499. J Comp Psychol. 2011. PMID: 21574689 Free PMC article.
-
Nearfield detection of dipole sources by the goldfish (Carassius auratus) and the mottled sculpin (Cottus bairdi).J Exp Biol. 1994 May;190:109-29. doi: 10.1242/jeb.190.1.109. J Exp Biol. 1994. PMID: 7964388
-
Lateral line stimulation patterns and prey orienting behavior in the Lake Michigan mottled sculpin (Cottus bairdi).J Comp Physiol A Neuroethol Sens Neural Behav Physiol. 2009 Mar;195(3):279-97. doi: 10.1007/s00359-008-0405-4. Epub 2009 Jan 10. J Comp Physiol A Neuroethol Sens Neural Behav Physiol. 2009. PMID: 19137317
-
The overlapping roles of the inner ear and lateral line: the active space of dipole source detection.Philos Trans R Soc Lond B Biol Sci. 2000 Sep 29;355(1401):1115-9. doi: 10.1098/rstb.2000.0650. Philos Trans R Soc Lond B Biol Sci. 2000. PMID: 11079381 Free PMC article. Review.
-
Hydrodynamic image formation by the peripheral lateral line system of the Lake Michigan mottled sculpin, Cottus bairdi.Philos Trans R Soc Lond B Biol Sci. 2000 Sep 29;355(1401):1111-4. doi: 10.1098/rstb.2000.0649. Philos Trans R Soc Lond B Biol Sci. 2000. PMID: 11079380 Free PMC article. Review.
Cited by
-
Perception of frequency, amplitude, and azimuth of a vibratory dipole source by the octavolateralis system of goldfish (Carassius auratus).J Comp Psychol. 2011 Aug;125(3):286-95. doi: 10.1037/a0023499. J Comp Psychol. 2011. PMID: 21574689 Free PMC article.
-
Hydrodynamic perception in true seals (Phocidae) and eared seals (Otariidae).J Comp Physiol A Neuroethol Sens Neural Behav Physiol. 2013 Jun;199(6):421-40. doi: 10.1007/s00359-012-0778-2. Epub 2012 Nov 24. J Comp Physiol A Neuroethol Sens Neural Behav Physiol. 2013. PMID: 23180048 Review.
-
Dipole source encoding and tracking by the goldfish auditory system.J Exp Biol. 2010 Oct 15;213(Pt 20):3536-47. doi: 10.1242/jeb.044909. J Exp Biol. 2010. PMID: 20889834 Free PMC article.
-
The oscar, Astronotus ocellatus, detects and discriminates dipole stimuli with the lateral line system.J Comp Physiol A Neuroethol Sens Neural Behav Physiol. 2011 Oct;197(10):959-68. doi: 10.1007/s00359-011-0656-3. Epub 2011 Jun 12. J Comp Physiol A Neuroethol Sens Neural Behav Physiol. 2011. PMID: 21667267
References
-
- Abboud JA, Coombs S. Mechanosensory-based orientation to elevated prey by a benthic fish. Mar Fresh Behav Physiol. 2000;33:261–279.
-
- Braun CB, Coombs S, Fay RR. What is the Nature of Multisensory Interaction between Octavolateralis Sub-Systems? Brain, Behavior and Evolution. 2002;59:162–176. - PubMed
-
- Braun CB, Grande T. Evolution of peripheral mechanisms for the enhancement of sound reception. In: Webb JA, Fay RR, Popper AN, editors. Fish Bioacoustics. New York: Springer; 2008. pp. 99–144.
-
- Casper BM, Mann DA. Dipole hearing measurements in elasmobranch fishes. J Exp Biol. 2007;210:75–81. - PubMed
-
- Coombs S. Nearfield detection of dipole sources by the goldfish (Carassius Auratus) and the mottled sculpin (Cottus Bairdi) Journal of Experimental Biology. 1994;190:109–129. - PubMed
