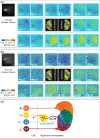
Localized direction selective responses in the dendrites of visual interneurons of the fly
- PMID: 20384983
- PMCID: PMC2876097
- DOI: 10.1186/1741-7007-8-36
Localized direction selective responses in the dendrites of visual interneurons of the fly
Abstract
Background: The various tasks of visual systems, including course control, collision avoidance and the detection of small objects, require at the neuronal level the dendritic integration and subsequent processing of many spatially distributed visual motion inputs. While much is known about the pooled output in these systems, as in the medial superior temporal cortex of monkeys or in the lobula plate of the insect visual system, the motion tuning of the elements that provide the input has yet received little attention. In order to visualize the motion tuning of these inputs we examined the dendritic activation patterns of neurons that are selective for the characteristic patterns of wide-field motion, the lobula-plate tangential cells (LPTCs) of the blowfly. These neurons are known to sample direction-selective motion information from large parts of the visual field and combine these signals into axonal and dendro-dendritic outputs.
Results: Fluorescence imaging of intracellular calcium concentration allowed us to take a direct look at the local dendritic activity and the resulting local preferred directions in LPTC dendrites during activation by wide-field motion in different directions. These 'calcium response fields' resembled a retinotopic dendritic map of local preferred directions in the receptive field, the layout of which is a distinguishing feature of different LPTCs.
Conclusions: Our study reveals how neurons acquire selectivity for distinct visual motion patterns by dendritic integration of the local inputs with different preferred directions. With their spatial layout of directional responses, the dendrites of the LPTCs we investigated thus served as matched filters for wide-field motion patterns.
Figures


Similar articles
-
Two classes of visual motion sensitive interneurons differ in direction and velocity dependency of in vivo calcium dynamics.J Neurobiol. 2001 Mar;46(4):289-300. doi: 10.1002/1097-4695(200103)46:4<289::aid-neu1009>3.0.co;2-w. J Neurobiol. 2001. PMID: 11180156
-
Dendro-dendritic interactions between motion-sensitive large-field neurons in the fly.J Neurosci. 2002 Apr 15;22(8):3227-33. doi: 10.1523/JNEUROSCI.22-08-03227.2002. J Neurosci. 2002. PMID: 11943823 Free PMC article.
-
Dendritic structure and receptive-field organization of optic flow processing interneurons in the fly.J Neurophysiol. 1998 Apr;79(4):1902-17. doi: 10.1152/jn.1998.79.4.1902. J Neurophysiol. 1998. PMID: 9535957
-
How do nerve cells compute? Dendritic integration in fly visual interneurones.Acta Physiol Scand. 1996 Jul;157(3):403-7. doi: 10.1046/j.1365-201X.1996.30250000.x. Acta Physiol Scand. 1996. PMID: 8830900 Review. No abstract available.
-
How fly neurons compute the direction of visual motion.J Comp Physiol A Neuroethol Sens Neural Behav Physiol. 2020 Mar;206(2):109-124. doi: 10.1007/s00359-019-01375-9. Epub 2019 Nov 5. J Comp Physiol A Neuroethol Sens Neural Behav Physiol. 2020. PMID: 31691093 Free PMC article. Review.
Cited by
-
Fine and distributed subcellular retinotopy of excitatory inputs to the dendritic tree of a collision-detecting neuron.J Neurophysiol. 2016 Jun 1;115(6):3101-12. doi: 10.1152/jn.00044.2016. Epub 2016 Mar 23. J Neurophysiol. 2016. PMID: 27009157 Free PMC article.
-
Dendritic Ca2+ dynamics and multimodal processing in a cricket antennal interneuron.J Neurophysiol. 2018 Sep 1;120(3):910-919. doi: 10.1152/jn.00663.2017. Epub 2018 May 9. J Neurophysiol. 2018. PMID: 29742027 Free PMC article.
-
Tonotopic Ca2+ dynamics and sound processing in auditory interneurons of the bush-cricket Mecopoda elongata.J Comp Physiol A Neuroethol Sens Neural Behav Physiol. 2024 May;210(3):353-369. doi: 10.1007/s00359-023-01638-6. Epub 2023 May 24. J Comp Physiol A Neuroethol Sens Neural Behav Physiol. 2024. PMID: 37222786 Free PMC article.
-
Species-Specific Flight Styles of Flies are Reflected in the Response Dynamics of a Homolog Motion-Sensitive Neuron.Front Integr Neurosci. 2012 Mar 19;6:11. doi: 10.3389/fnint.2012.00011. eCollection 2012. Front Integr Neurosci. 2012. PMID: 22485089 Free PMC article.
-
Predictive features of persistent activity emergence in regular spiking and intrinsic bursting model neurons.PLoS Comput Biol. 2012;8(4):e1002489. doi: 10.1371/journal.pcbi.1002489. Epub 2012 Apr 26. PLoS Comput Biol. 2012. PMID: 22570601 Free PMC article.
References
-
- Krapp HG, Hengstenberg B, Hengstenberg R. Neuronal matched filters for optic flow processing in flying insects. Int Rev Neurobiol. 2000;44:93–120. full_text. - PubMed
Publication types
MeSH terms
LinkOut - more resources
Full Text Sources

