

Shape based kinetic outlier detection in real-time PCR
- PMID: 20385019
- PMCID: PMC2873533
- DOI: 10.1186/1471-2105-11-186
Shape based kinetic outlier detection in real-time PCR
Abstract
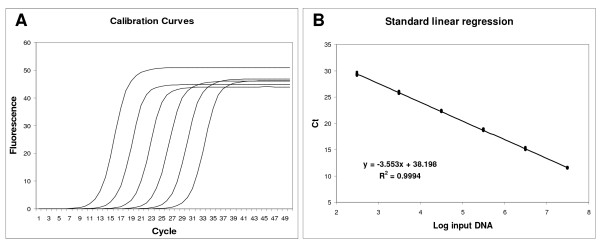
Background: Real-time PCR has recently become the technique of choice for absolute and relative nucleic acid quantification. The gold standard quantification method in real-time PCR assumes that the compared samples have similar PCR efficiency. However, many factors present in biological samples affect PCR kinetic, confounding quantification analysis. In this work we propose a new strategy to detect outlier samples, called SOD.
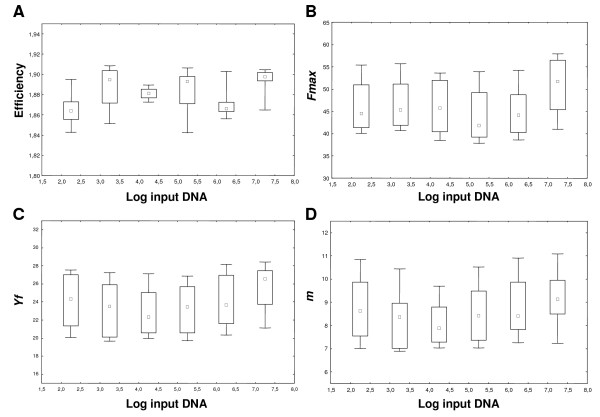
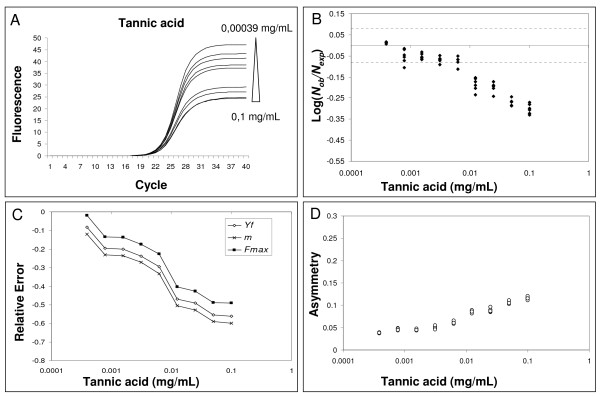
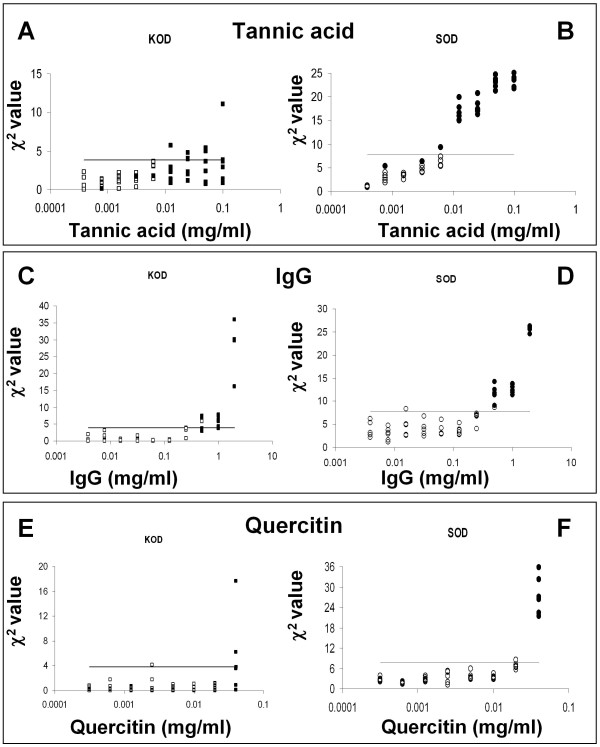
Results: Richards function was fitted on fluorescence readings to parameterize the amplification curves. There was not a significant correlation between calculated amplification parameters (plateau, slope and y-coordinate of the inflection point) and the Log of input DNA demonstrating that this approach can be used to achieve a "fingerprint" for each amplification curve. To identify the outlier runs, the calculated parameters of each unknown sample were compared to those of the standard samples. When a significant underestimation of starting DNA molecules was found, due to the presence of biological inhibitors such as tannic acid, IgG or quercitin, SOD efficiently marked these amplification profiles as outliers. SOD was subsequently compared with KOD, the current approach based on PCR efficiency estimation. The data obtained showed that SOD was more sensitive than KOD, whereas SOD and KOD were equally specific.
Conclusion: Our results demonstrated, for the first time, that outlier detection can be based on amplification shape instead of PCR efficiency. SOD represents an improvement in real-time PCR analysis because it decreases the variance of data thus increasing the reliability of quantification.
Figures
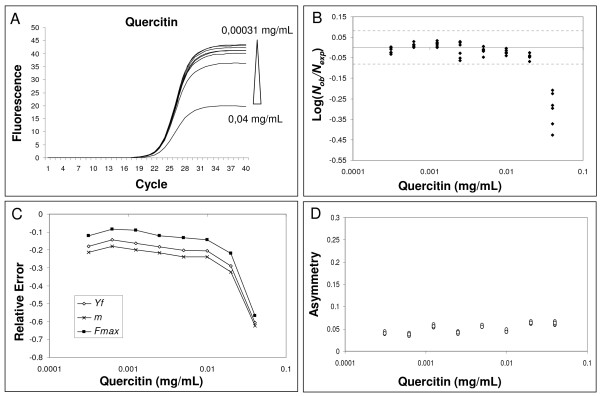
 ; where
  is the mean of parameter calculated for each inhibitor concentration;
  represents the mean of parameter value from standard curve samples (C). Right lower panel: asymmetry values versus increasing inhibitor concentration. Asymmetry was computed as the following ratio:
  (D).
(D).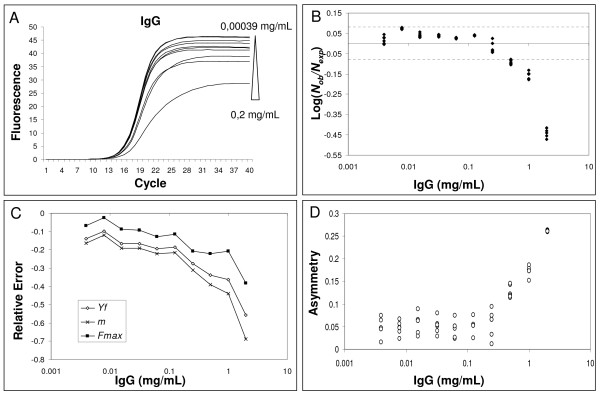
References
-
- VanGuilder HD, Vrana KE, Freeman WM. Twenty-five years of quantitative PCR for gene expression analysis. Bio Techniques. 2008;44(5):619–626. - PubMed
MeSH terms
LinkOut - more resources
Full Text Sources
Other Literature Sources
