

Cardiac expression of skeletal muscle sodium channels increases longitudinal conduction velocity in the canine 1-week myocardial infarction
- PMID: 20385252
- PMCID: PMC3703522
- DOI: 10.1016/j.hrthm.2010.04.009
Cardiac expression of skeletal muscle sodium channels increases longitudinal conduction velocity in the canine 1-week myocardial infarction
Abstract
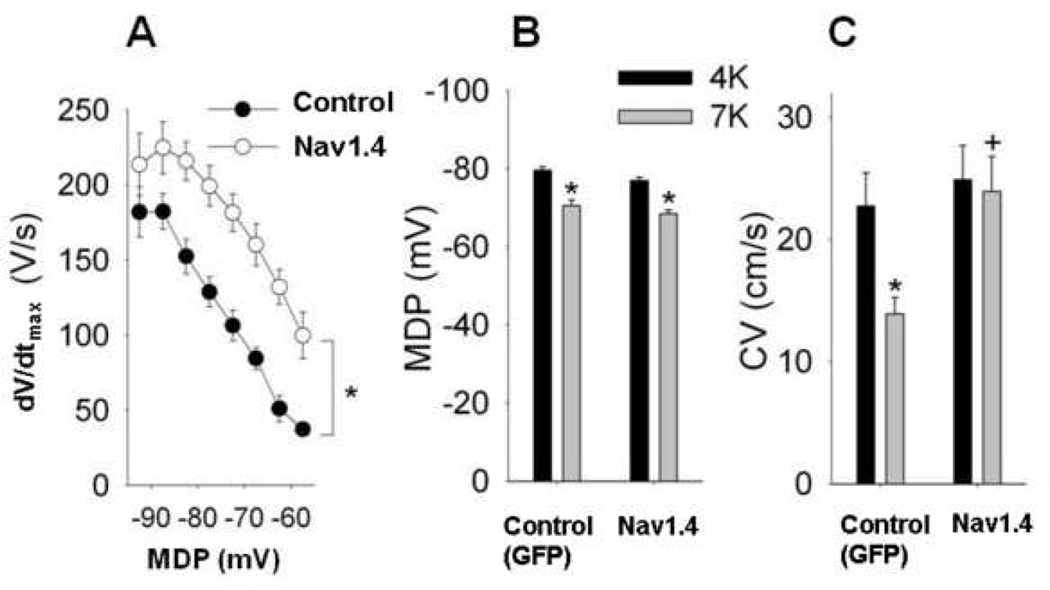
Background: Skeletal muscle sodium channel (Nav1.4) expression in border zone myocardium increases action potential upstroke velocity in depolarized isolated tissue. Because resting membrane potential in the 1-week canine infarct is reduced, we hypothesized that conduction velocity (CV) is greater in Nav1.4 dogs compared with in control dogs.
Objective: The purpose of this study was to measure CV in the infarct border zone border in dogs with and without Nav1.4 expression.
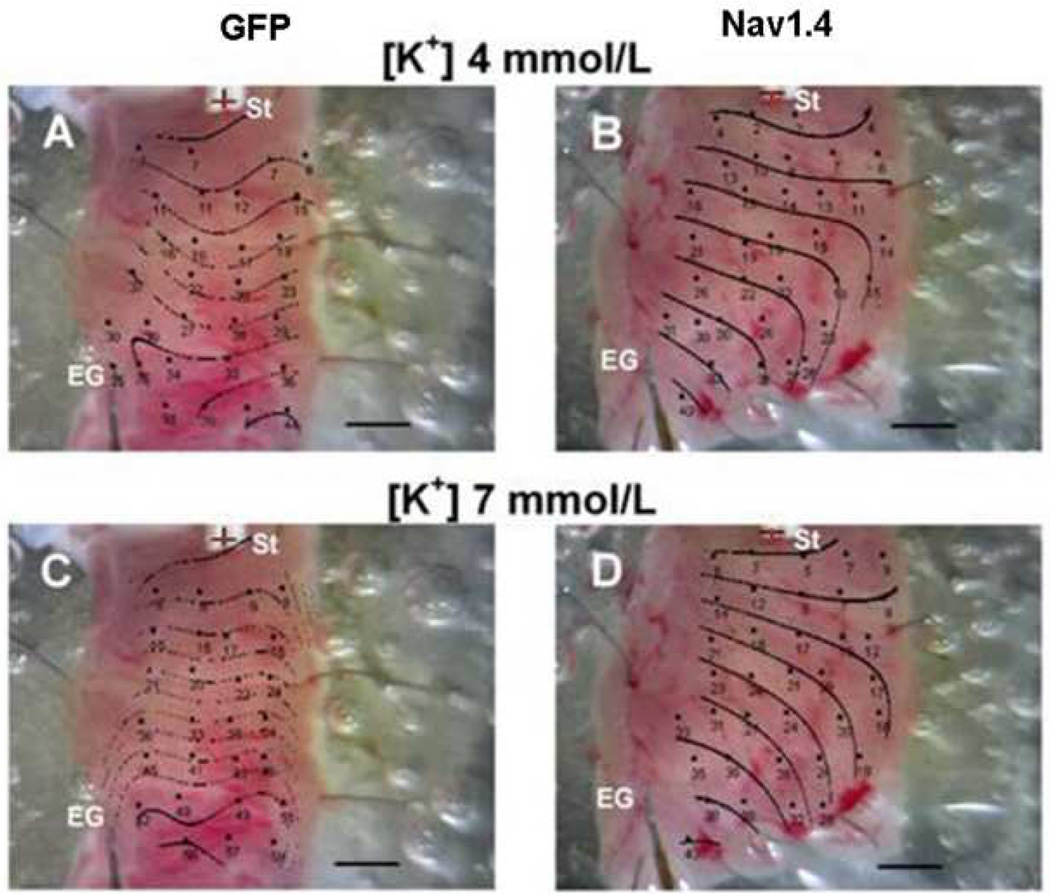
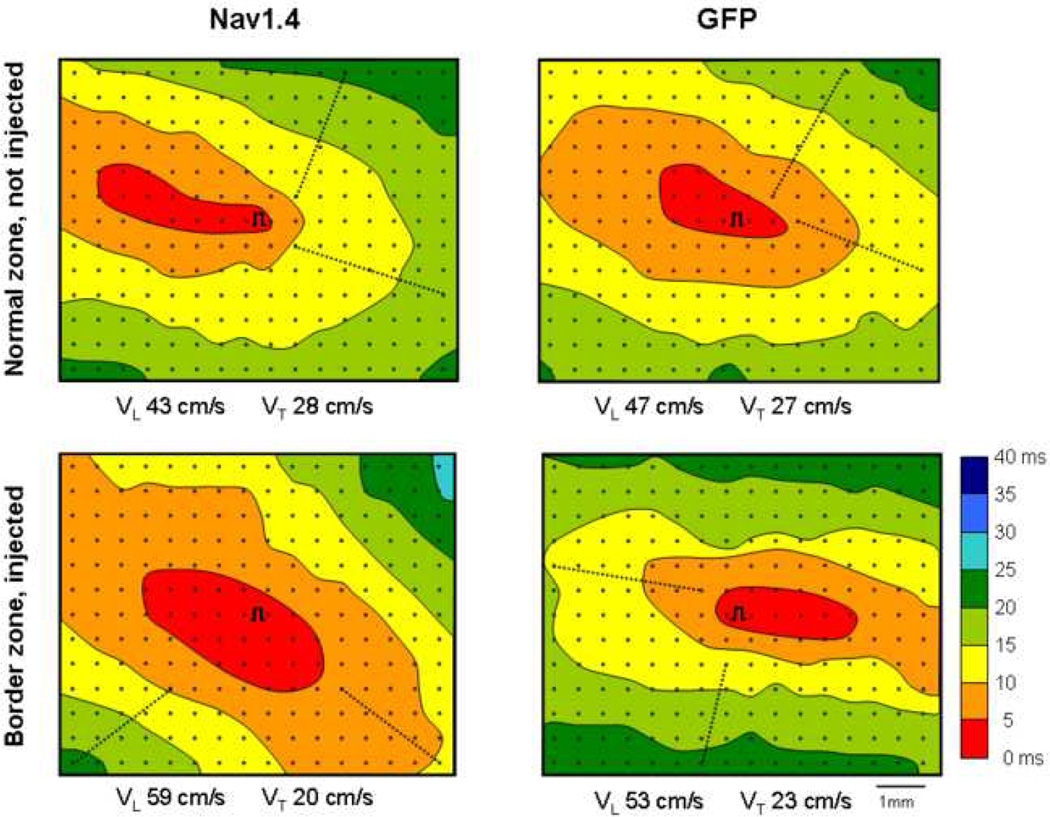
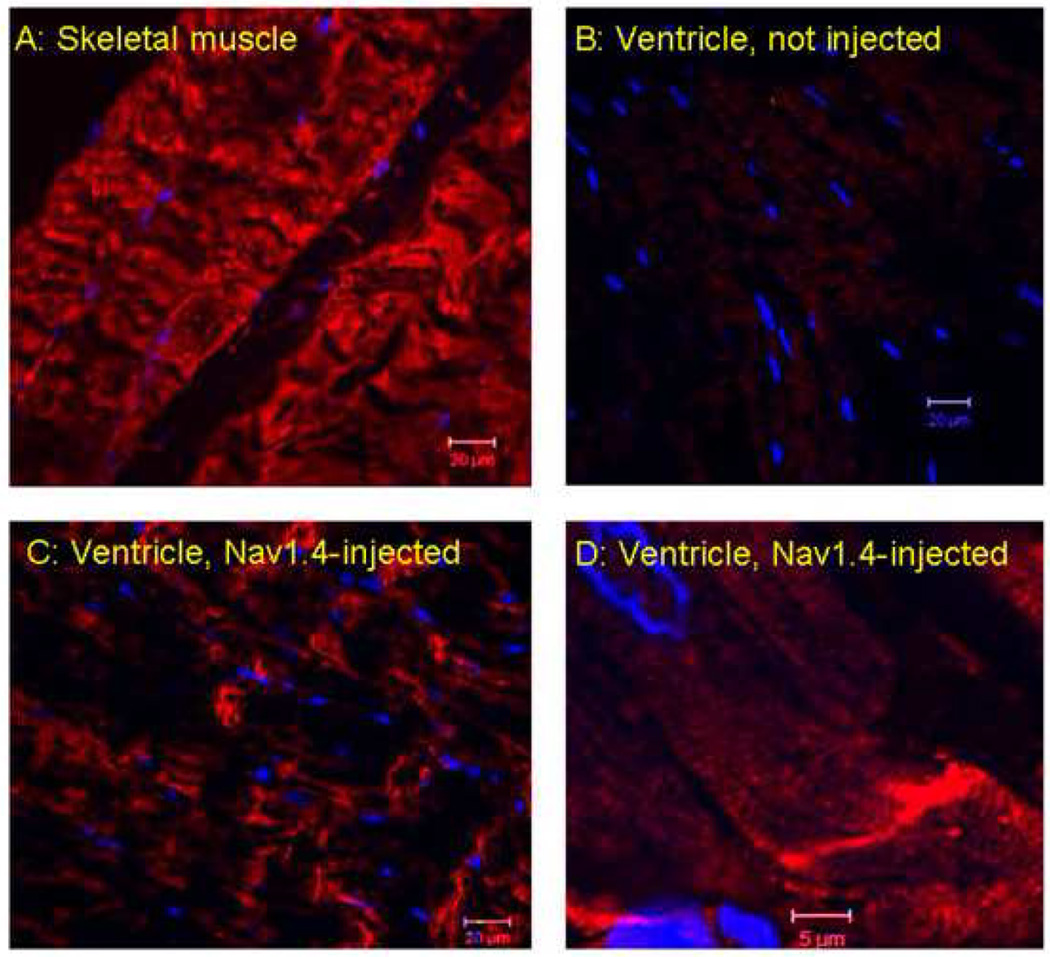
Methods: Adenovirus was injected in the infarct border zone in 34 dogs. The adenovirus incorporated the Nav1.4- and a green fluorescent protein (GFP) gene (Nav1.4 group, n = 16) or only GFP (n = 18). After 1 week, upstroke velocity and CV were measured by sequential microelectrode recordings at 4 and 7 mM [K(+)] in superfused epicardial slabs. High-density in vivo epicardial activation mapping was performed in a subgroup (8 Nav1.4, 6 GFP) at three to four locations in the border zone. Microscopy and antibody staining confirmed GFP or Nav1.4 expression.
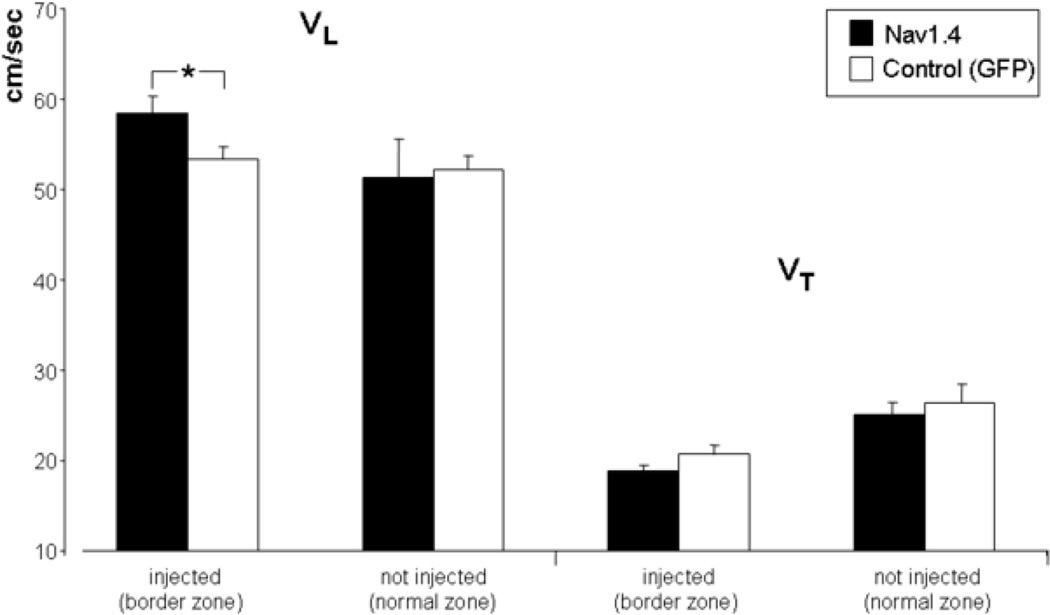
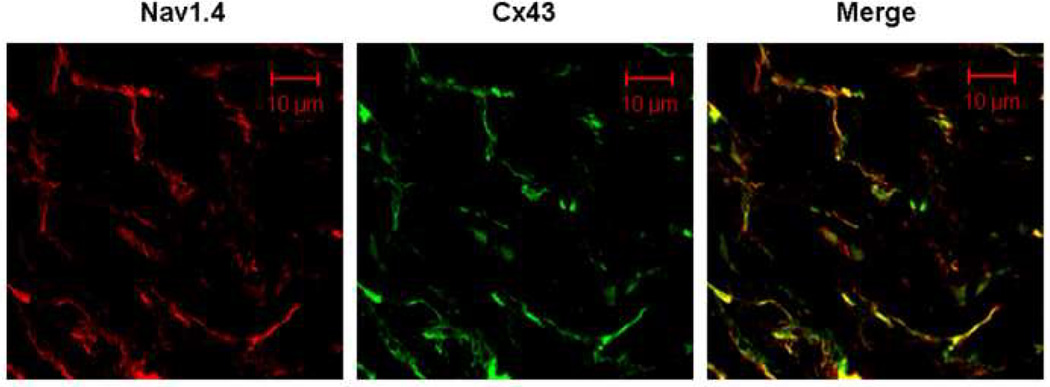
Results: Infarct sizes were similar between groups (30.6% +/- 3% of left ventricle mass, mean +/- standard error of the mean). Longitudinal CV was greater in Nav1.4 than in GFP sites (58.5 +/- 1.8 vs. 53.3 +/- 1.2 cm/s, 20 and 15 sites, respectively; P <.05). Transverse CV was not different between the groups. In tissue slabs, dV/dt(max) was higher and CV was greater in Nav1.4 than in control at 7 mM [K(+)] (P <.05). Immunohistochemical Nav1.4 staining was seen at the longitudinal ends of the myocytes.
Conclusion: Nav1.4 channels in myocardium surviving 1 week infarction increases longitudinal but not transverse CV, consistent with the increased dV/dt(max) and with the cellular localization of Nav1.4.
Copyright 2010 Heart Rhythm Society. Published by Elsevier Inc. All rights reserved.
Conflict of interest statement
Figures
Comment in
-
Na+ channel transfection to rescue propagation.Heart Rhythm. 2010 Aug;7(8):1111-2. doi: 10.1016/j.hrthm.2010.05.007. Epub 2010 May 11. Heart Rhythm. 2010. PMID: 20466071 No abstract available.
References
-
- Janse MJ, Wit AL. Electrophysiological mechanisms of ventricular arrhythmias resulting from myocardial ischemia and infarction. Physiol Rev. 1989;69:1049–1169. - PubMed
-
- Wit AL, Janse MJ. Experimental models of ventricular tachycardia and fibrillation caused by ischemia and infarction. Circulation. 1992 - PubMed
-
- Mines GR. On circulating excitations in heart muscles and their possible relation to tachycardia and fibrillation. Trans. Royal Society of Canada. 1914;Sect.IV:43–53.
-
- Working group on arrhythmias of the European Society of Cardiology: The Sicilian Gambit. A new approach to the classification of antiarrhythmic drugs based on their actions on arrhythmogenic mechanisms. Circulation. 1991;84:1831–1851. - PubMed
-
- Schmitt FO, Erlanger J. Directional differences in the conduction of the impulse through heart muscle and their possible relation to extrasystolic amd fibrillary contractions. Am J Physiol. 1928;87:326–347.
Publication types
MeSH terms
Substances
Grants and funding
LinkOut - more resources
Full Text Sources
Medical
