. 2010 Jun 11;285(24):18545-54.
doi: 10.1074/jbc.M110.125211. Epub 2010 Apr 12.

Unique bell-shaped voltage-dependent modulation of Na+ channel gating by novel insect-selective toxins from the spider Agelena orientalis

Affiliations

Unique bell-shaped voltage-dependent modulation of Na+ channel gating by novel insect-selective toxins from the spider Agelena orientalis

Bert Billen et al. J Biol Chem. .

Abstract

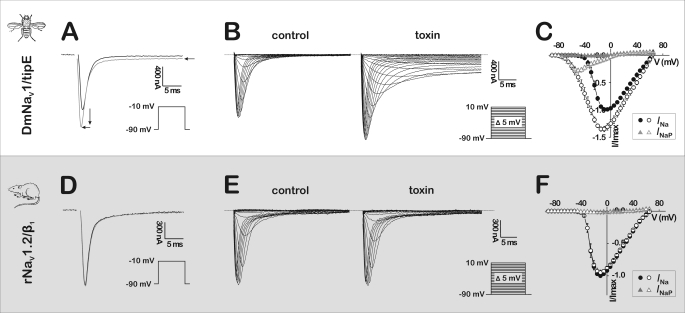
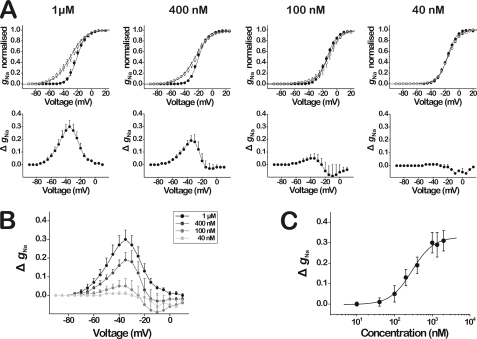
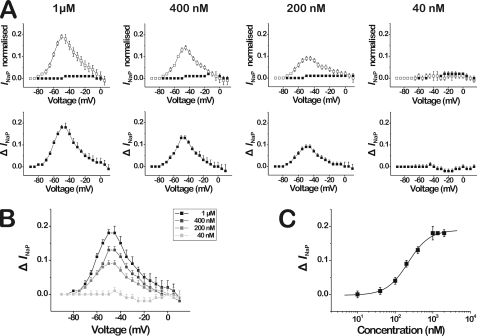
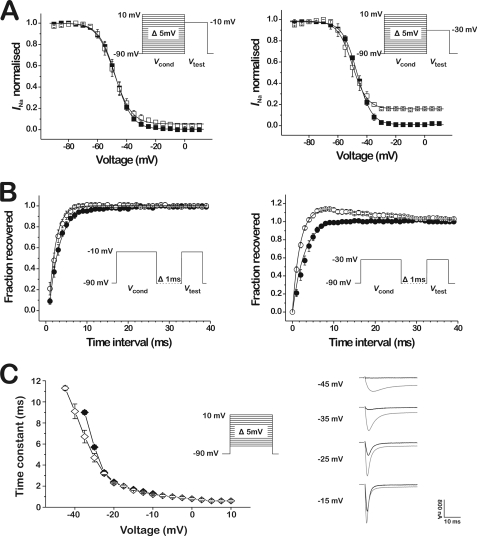
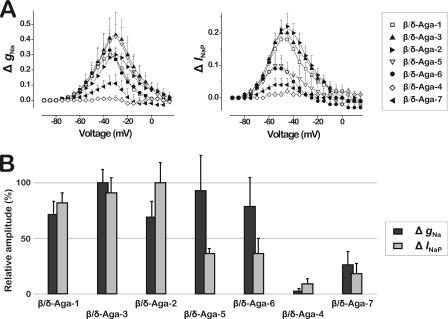
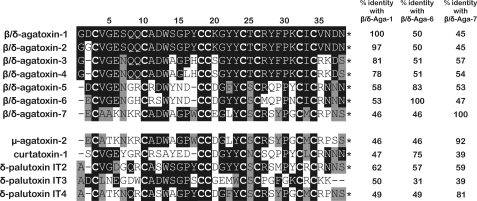
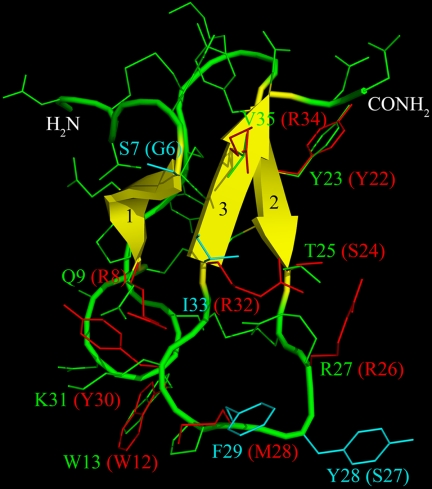
Spider venoms provide a highly valuable source of peptide toxins that act on a wide diversity of membrane-bound receptors and ion channels. In this work, we report isolation, biochemical analysis, and pharmacological characterization of a novel family of spider peptide toxins, designated beta/delta-agatoxins. These toxins consist of 36-38 amino acid residues and originate from the venom of the agelenid funnel-web spider Agelena orientalis. The presented toxins show considerable amino acid sequence similarity to other known toxins such as mu-agatoxins, curtatoxins, and delta-palutoxins-IT from the related spiders Agelenopsis aperta, Hololena curta, and Paracoelotes luctuosus. beta/delta-Agatoxins modulate the insect Na(V) channel (DmNa(V)1/tipE) in a unique manner, with both the activation and inactivation processes being affected. The voltage dependence of activation is shifted toward more hyperpolarized potentials (analogous to site 4 toxins) and a non-inactivating persistent Na(+) current is induced (site 3-like action). Interestingly, both effects take place in a voltage-dependent manner, producing a bell-shaped curve between -80 and 0 mV, and they are absent in mammalian Na(V) channels. To the best of our knowledge, this is the first detailed report of peptide toxins with such a peculiar pharmacological behavior, clearly indicating that traditional classification of toxins according to their binding sites may not be as exclusive as previously assumed.


Figures

FIGURE 1.
FIGURE 1.
Purification of β/δ-agatoxins. RP-HPLC of A. orientalis crude venom on a Jupiter C5 column (4.6 × 150 mm) using a linear gradient of acetonitrile concentration in 0.1% triethylamine (shown with a line). Numbered fractions contain toxins active on DmNaV1/tipE channels: 1, β/δ-Aga-5; 2, β/δ-Aga-4; 3, β/δ-Aga-6; 4, β/δ-Aga-7; 5, β/δ-Aga-1; 6, β/δ-Aga-2; and 7, β/δ-Aga-3.
FIGURE 2.
FIGURE 2.
Activity of β/δ-Aga-1 on NaV channels. Typical effects induced by β/δ-Aga-1 on currents from the cloned insect Na+ channel DmNaV1/tipE from D. melanogaster (A–C) and the cloned mammalian Na+ channel rNaV1.2/β1 from R. norvegicus (D–F), expressed in X. laevis oocytes. A and D, representative whole cell current traces in control (black trace) and in the presence of 1 μm β/δ-Aga-1 (gray trace). Arrows indicate the toxin-induced effect on the current of DmNaV1/tipE: an increase in peak amplitude, a decrease in time-to-peak, and the generation of a persistent current. B and E, superimposed representative whole cell current traces elicited by 5-mV step depolarizations between −90 and 10 mV in control (left) and in the presence of 1 μm β/δ-Aga-1 (right). The dotted line indicates the zero current level. C and F, normalized current-voltage relationships (n = 6 for DmNaV1/tipE and n = 3 for rNaV1.2/β1) of transient peak currents (INa, black circles) and persistent currents measured after 50 ms (INaP, gray triangles) in control (closed symbols) and in the presence of 1 μm β/δ-Aga-1 (open symbols).
FIGURE 3.
FIGURE 3.
Bell-shaped voltage dependence of the effects of β/δ-Aga-1 on the activation of the insect Na+ channel DmNaV1/tipE. A, upper panels show the steady-state activation curves (n = 3–6) in control (closed circles) and in the presence of varying concentrations of β/δ-Aga-1 (open circles). All steady-state activation curves are fit with the Boltzmann equation. The bottom panels display the subtraction (toxin minus control) of the normalized gNa values (ΔgNa), revealing the voltage range wherein the toxin-induced effects on the activation occur. B, superimposed curves of the ΔgNa at varying concentrations of β/δ-Aga-1 (see inset at upper right), showing the concentration dependence of the toxin-induced effects on the activation. C, dose-response curve of the ΔgNa measured at −35 mV (i.e. the voltage at which the effect of toxin on gNa is maximal). The data are fit with the Hill equation, yielding an EC50 value of 288.2 ± 116.4 nm (n = 3–6; Hill coefficient is 1.5 ± 0.7).
FIGURE 4.
FIGURE 4.
Bell-shaped voltage dependence of the persistent currents (INaP) induced by β/δ-Aga-1 on the insect Na+ channel DmNaV1/tipE. To quantify INaP, the current amplitude after 50 ms was normalized to peak current amplitude. A, upper panels show the normalized INaP (n = 3–6) in control (closed circles) and in the presence of varying concentrations of β/δ-Aga-1 (open circles). The bottom panels display the subtraction (toxin minus control) of the normalized INaP values (ΔINaP), revealing the voltage range wherein the toxin-induced persistent currents occur. B, superimposed curves of the ΔINaP at varying concentrations of β/δ-Aga-1 (see inset at upper right), showing the concentration dependence of the toxin-induced persistent currents. C, dose-response curve of the ΔINaP at −45 mV (i.e. the voltage at which the toxin-induced persistent currents are maximal). The data are fit with the Hill equation, yielding an EC50 value of 220.2 ± 32.9 nm (n = 3–6, Hill coefficient 1.5 ± 0.4).
FIGURE 5.
FIGURE 5.
Effect of β/δ-Aga-1 on the inactivation process of the insect Na+ channel DmNaV1/tipE. A, steady-state inactivation curves (n = 3–6) in control (closed squares) and in the presence of 1 μm β/δ-Aga-1 (open squares). Test voltage is set at −10 mV in the left graph and −30 mV in the right graph. B, recovery from inactivation (n = 4) in control (closed circles) and in the presence of 1 μm β/δ-Aga-1 (open circles). Test voltage is set at −10 mV in the left graph and −30 mV in the right graph. C, voltage dependence of the time constants of fast inactivation of DmNaV1/tipE (n = 4) in control (closed diamonds) and in the presence of 1 μm β/δ-Aga-1 (open diamonds). On the right, superimposed representative current traces in control (black traces) and in the presence of 1 μm β/δ-Aga-1 (gray traces) at different test potentials.
FIGURE 6.
FIGURE 6.
Comparison of the effects of the β/δ-agatoxin homologues on the insect Na+ channel DmNaV1/tipE. To facilitate a proper comparison, all data represent experiments conducted at a toxin concentration of 1 μm (n = 3–6). A, superimposed bell-shaped curves showing the amplitude of the effects of β/δ-agatoxin homologues on the activation (left graph) and the persistent currents (right graph). Analysis of the toxin-induced effects on activation (ΔgNa) and persistent currents (ΔINaP) were done in the same manner as in Figs. 3 and 4, respectively. B, bar diagrams showing the relative amplitudes of the effects on the activation (represented by ΔgNa measured at −35 mV) and the persistent currents (represented by ΔINaP measured at −45 mV). Amplitudes were normalized by setting the β/δ-agatoxin homologue with the highest effect as 100%.
FIGURE 7.
FIGURE 7.
Comparison of the amino acid sequences of β/δ-agatoxins and similar spider toxins. Sequence identities are shown relative to β/δ-Aga-1, β/δ-Aga-6, and β/δ-Aga-7. Amino acid residues identical with β/δ-Aga-1 are shown on a black background, conservative substitutions are shown on a gray background, and cysteine residues are printed in bold. Breaks (dashes) have been introduced to maximize alignment. All the aligned toxins except for δ-Palu-IT3 are C-terminally amidated, as indicated by asterisks.
FIGURE 8.
FIGURE 8.
Spatial structure model of β/δ-Aga-1. Model was built on the basis of the structure of the homologous δ-palutoxin-IT2 (PDB accession code: 1V91). Main-chain atoms are hidden, side chains are shown as lines, N and C termini are labeled, and β-strands are colored yellow and numbered. Presumed functionally important residues are indicated, the corresponding residues of δ-Palu-IT2 are given in parenthesis; the putative pharmacophore of δ-Palu-IT2 (23) is colored red; and residues believed to conform the scorpion β-toxin-like activity to β/δ-Aga-1 are marked cyan.

Similar articles

Cited by

References

    1. Estrada G., Villegas E., Corzo G. (2007) Nat. Prod. Rep. 24, 145–161 - PubMed
    1. Grishin E. (1999) Eur. J. Biochem. 264, 276–280 - PubMed
    1. Rash L. D., Hodgson W. C. (2002) Toxicon 40, 225–254 - PubMed
    1. Vassilevski A. A., Kozlov S. A., Grishin E. V. (2009) Biochemistry 74, 1505–1534 - PubMed
    1. Catterall W. A. (2000) Neuron 26, 13–25 - PubMed

Publication types