

Kinetic analysis of the three-step steroid aromatase reaction of human cytochrome P450 19A1
- PMID: 20385561
- PMCID: PMC2878537
- DOI: 10.1074/jbc.M110.123711
Kinetic analysis of the three-step steroid aromatase reaction of human cytochrome P450 19A1
Abstract
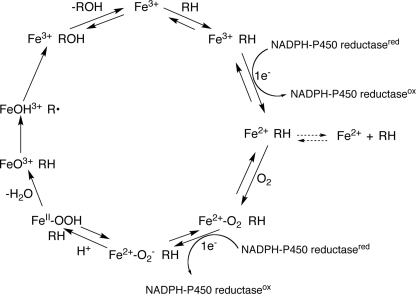
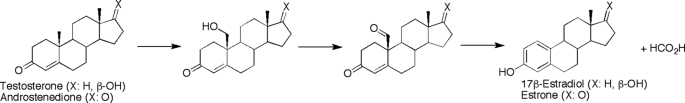
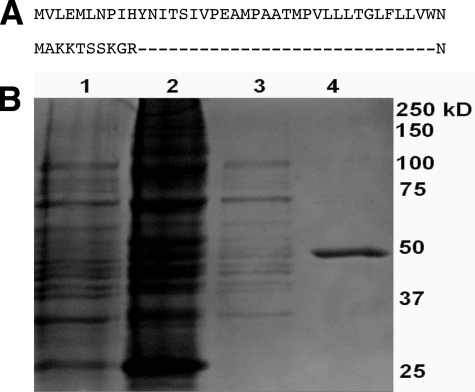
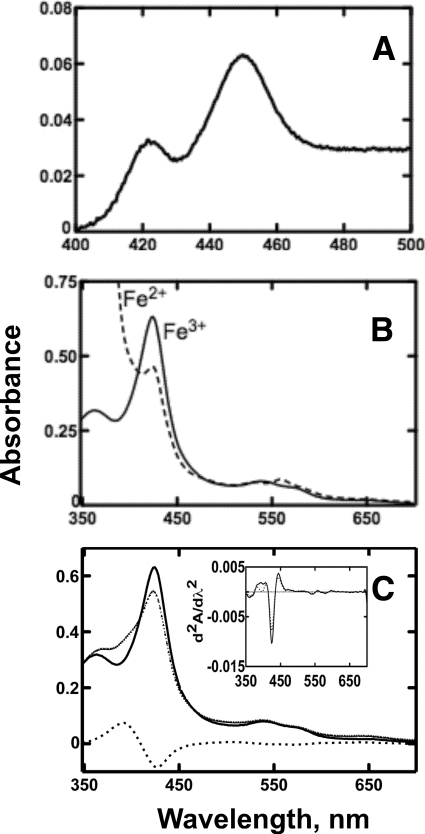
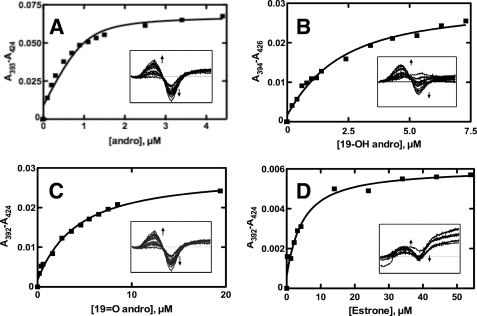
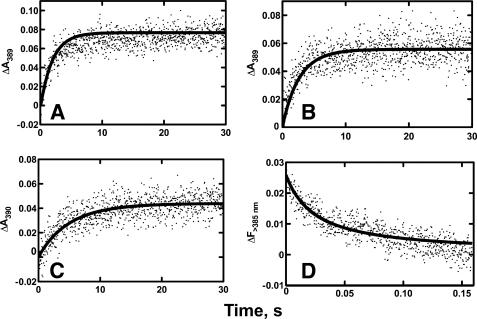
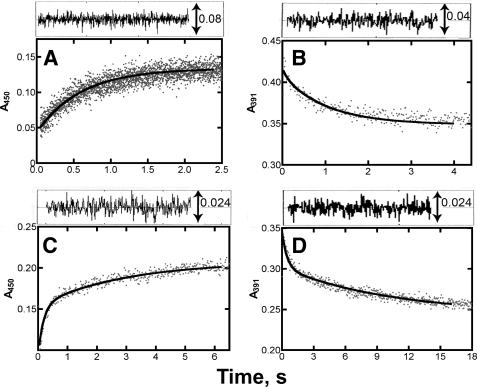
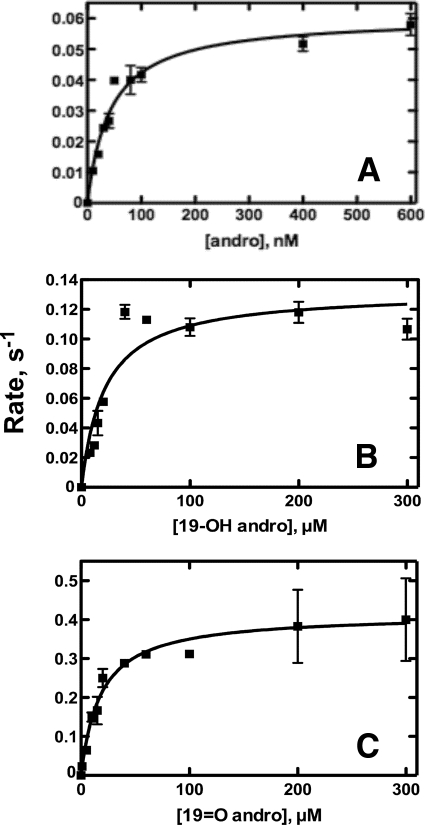
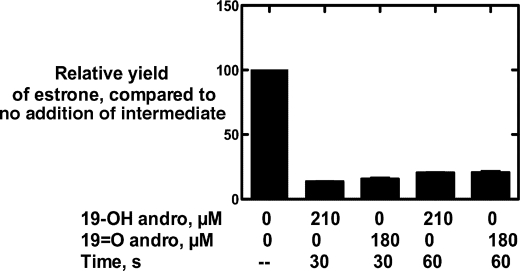
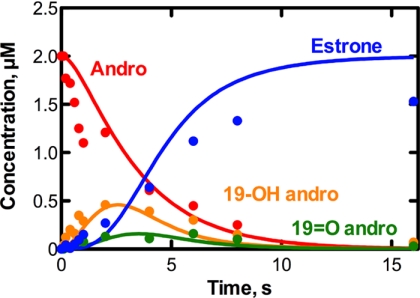
Cytochrome P450 19A1 (P450 19A1), the aromatase, catalyzes the conversion of androgens to estrogens through a sequential three-step reaction, generating 19-hydroxy and 19-aldehyde intermediates en route to the product estrogen. A procedure for the heterologous expression and purification of P450 19A1 in Escherichia coli was developed (k(cat) of 0.06 s(-1) for the conversion of androstenedione to estrone). Binding of the substrate and intermediates show low micromolar dissociation constants and are at least two-step processes. Rates of reduction of the iron were fast in the presence of substrate, either intermediate, or product. P450 19A1 is a distributive rather than a processive enzyme, with the sequential reaction allowing free dissociation of the intermediates as revealed by pulse-chase experiments. Conversion of androstenedione to estrone (under single turnover conditions) generated a progress curve showing changes in the concentrations of the substrate, intermediates, and product. A minimal kinetic model containing the individual rate constants for the steps in P450 19A1 catalysis was developed to globally fit the time course of the overall reaction, the dissociation constants, the two-step ligand binding, the distributive character, the iron-reduction rates, and the steady-state conversion of the 19-hydroxy androstenedione and 19-aldehyde androstenedione intermediates to estrone.
Figures
Similar articles
-
Roles of Ferric Peroxide Anion Intermediates (Fe3+O2 -, Compound 0) in Cytochrome P450 19A1 Steroid Aromatization and a Cytochrome P450 2B4 Secosteroid Oxidation Model.Angew Chem Int Ed Engl. 2024 Aug 12;63(33):e202406542. doi: 10.1002/anie.202406542. Epub 2024 Jul 17. Angew Chem Int Ed Engl. 2024. PMID: 38820076 Free PMC article.
-
Human placental estrogen synthetase (aromatase). Effect of environment on the kinetics of protein-protein and substrate-protein interactions and the production of 19-oxygenated androgen intermediates in the purified reconstituted cytochrome P450 enzyme system.J Steroid Biochem Mol Biol. 1991 Sep;39(3):381-94. doi: 10.1016/0960-0760(91)90050-f. J Steroid Biochem Mol Biol. 1991. PMID: 1911429
-
Enolization as an alternative proton delivery pathway in human aromatase (P450 19A1).J Phys Chem B. 2014 Jan 16;118(2):390-405. doi: 10.1021/jp407365x. Epub 2014 Jan 7. J Phys Chem B. 2014. PMID: 24369956
-
Multi-step oxidations catalyzed by cytochrome P450 enzymes: Processive vs. distributive kinetics and the issue of carbonyl oxidation in chemical mechanisms.Arch Biochem Biophys. 2011 Mar 1;507(1):126-34. doi: 10.1016/j.abb.2010.08.017. Epub 2010 Sep 4. Arch Biochem Biophys. 2011. PMID: 20804723 Free PMC article. Review.
-
Updates on Mechanisms of Cytochrome P450 Catalysis of Complex Steroid Oxidations.Int J Mol Sci. 2024 Aug 20;25(16):9020. doi: 10.3390/ijms25169020. Int J Mol Sci. 2024. PMID: 39201706 Free PMC article. Review.
Cited by
-
A network-based pharmacological study on the mechanism of action of muscone in breast cancer.Transl Cancer Res. 2022 May;11(5):1195-1206. doi: 10.21037/tcr-22-667. Transl Cancer Res. 2022. PMID: 35706803 Free PMC article.
-
Formation and Cleavage of C-C Bonds by Enzymatic Oxidation-Reduction Reactions.Chem Rev. 2018 Jul 25;118(14):6573-6655. doi: 10.1021/acs.chemrev.8b00031. Epub 2018 Jun 22. Chem Rev. 2018. PMID: 29932643 Free PMC article. Review.
-
The relationships between cytochromes P450 and H2O2: Production, reaction, and inhibition.J Inorg Biochem. 2018 Sep;186:228-234. doi: 10.1016/j.jinorgbio.2018.05.014. Epub 2018 May 23. J Inorg Biochem. 2018. PMID: 29990746 Free PMC article. Review.
-
Heme-thiolate sulfenylation of human cytochrome P450 4A11 functions as a redox switch for catalytic inhibition.J Biol Chem. 2017 Jul 7;292(27):11230-11242. doi: 10.1074/jbc.M117.792200. Epub 2017 May 22. J Biol Chem. 2017. PMID: 28533430 Free PMC article.
-
Sex hormones and risk of lung and colorectal cancers in women: a Mendelian randomization study.Sci Rep. 2024 Oct 12;14(1):23891. doi: 10.1038/s41598-024-75305-4. Sci Rep. 2024. PMID: 39396092 Free PMC article.
References
-
- Ortiz de Montellano P. R. (ed) (2005) Cytochrome P450s: Structure, Mechanism, and Biochemistry, 3rd Ed., Kluwer Academic/Plenum Publishers, New York
-
- Nelson D. R. (2003) Arch. Biochem. Biophys. 409, 18–24 - PubMed
-
- Guengerich F. P. (2001) Chem. Res. Toxicol. 14, 611–650 - PubMed
-
- Sohl C. D., Isin E. M., Eoff R. L., Marsch G. A., Stec D. F., Guengerich F. P. (2008) J. Biol. Chem. 283, 7293–7308 - PubMed
Publication types
MeSH terms
Substances
Grants and funding
LinkOut - more resources
Full Text Sources
Molecular Biology Databases
Research Materials
Miscellaneous
