

Unconstrained mining of transcript data reveals increased alternative splicing complexity in the human transcriptome
- PMID: 20385588
- PMCID: PMC2919708
- DOI: 10.1093/nar/gkq197
Unconstrained mining of transcript data reveals increased alternative splicing complexity in the human transcriptome
Abstract
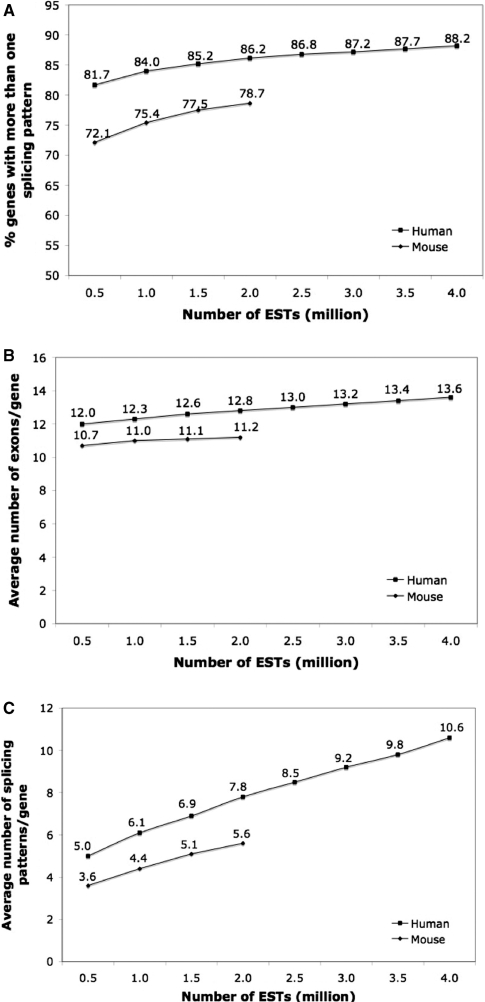
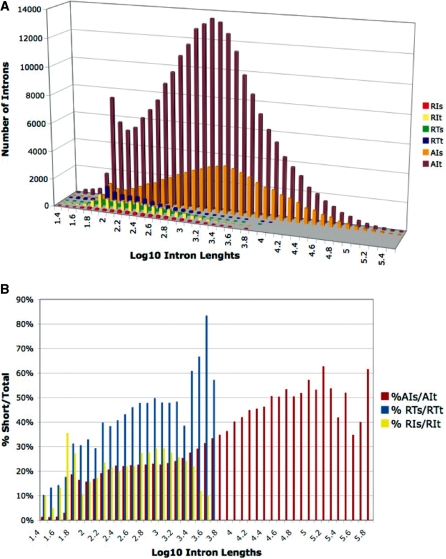
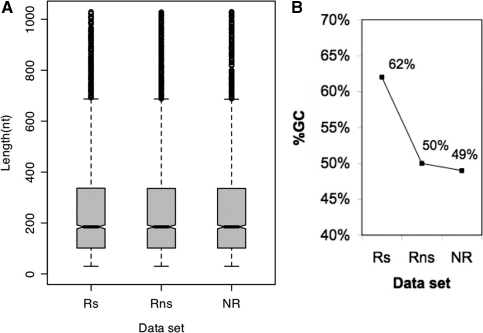
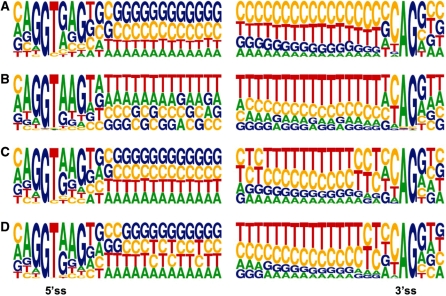
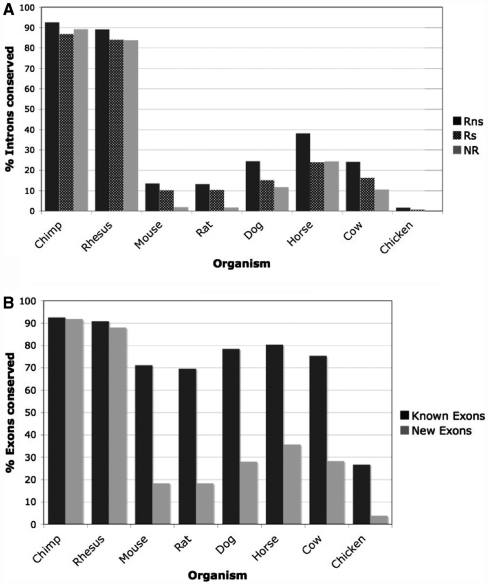
Mining massive amounts of transcript data for alternative splicing information is paramount to help understand how the maturation of RNA regulates gene expression. We developed an algorithm to cluster transcript data to annotated genes to detect unannotated splice variants. A higher number of alternatively spliced genes and isoforms were found compared to other alternative splicing databases. Comparison of human and mouse data revealed a marked increase, in human, of splice variants incorporating novel exons and retained introns. Previously unannotated exons were validated by tiling array expression data and shown to correspond preferentially to novel first exons. Retained introns were validated by tiling array and deep sequencing data. The majority of retained introns were shorter than 500 nt and had weak polypyrimidine tracts. A subset of retained introns matching small RNAs and displaying a high GC content suggests a possible coordination between splicing regulation and production of noncoding RNAs. Conservation of unannotated exons and retained introns was higher in horse, dog and cow than in rodents, and 64% of exon sequences were only found in primates. This analysis highlights previously bypassed alternative splice variants, which may be crucial to deciphering more complex pathways of gene regulation in human.
Figures
Similar articles
-
Human GC-AG alternative intron isoforms with weak donor sites show enhanced consensus at acceptor exon positions.Nucleic Acids Res. 2001 Jun 15;29(12):2581-93. doi: 10.1093/nar/29.12.2581. Nucleic Acids Res. 2001. PMID: 11410667 Free PMC article.
-
Categorization and characterization of transcript-confirmed constitutively and alternatively spliced introns and exons from human.Hum Mol Genet. 2002 Feb 15;11(4):451-64. doi: 10.1093/hmg/11.4.451. Hum Mol Genet. 2002. PMID: 11854178
-
Unusual intron conservation near tissue-regulated exons found by splicing microarrays.PLoS Comput Biol. 2006 Jan;2(1):e4. doi: 10.1371/journal.pcbi.0020004. Epub 2006 Jan 20. PLoS Comput Biol. 2006. PMID: 16424921 Free PMC article.
-
Exonization of transposed elements: A challenge and opportunity for evolution.Biochimie. 2011 Nov;93(11):1928-34. doi: 10.1016/j.biochi.2011.07.014. Epub 2011 Jul 26. Biochimie. 2011. PMID: 21787833 Review.
-
The Protein-Coding Human Genome: Annotating High-Hanging Fruits.Bioessays. 2019 Nov;41(11):e1900066. doi: 10.1002/bies.201900066. Epub 2019 Sep 23. Bioessays. 2019. PMID: 31544971 Review.
Cited by
-
Intron Retention and Alzheimer's Disease (AD): A Review of Regulation Genes Implicated in AD.Genes (Basel). 2025 Jun 30;16(7):782. doi: 10.3390/genes16070782. Genes (Basel). 2025. PMID: 40725435 Free PMC article. Review.
-
ExoLocator--an online view into genetic makeup of vertebrate proteins.Nucleic Acids Res. 2014 Jan;42(Database issue):D879-81. doi: 10.1093/nar/gkt1164. Epub 2013 Nov 23. Nucleic Acids Res. 2014. PMID: 24271393 Free PMC article.
-
Dynamic usage of alternative splicing exons during mouse retina development.Nucleic Acids Res. 2011 Oct;39(18):7920-30. doi: 10.1093/nar/gkr545. Epub 2011 Jun 30. Nucleic Acids Res. 2011. PMID: 21724604 Free PMC article.
-
Evolution of gene structural complexity: an alternative-splicing-based model accounts for intron-containing retrogenes.Plant Physiol. 2014 May;165(1):412-23. doi: 10.1104/pp.113.231696. Epub 2014 Feb 11. Plant Physiol. 2014. PMID: 24520158 Free PMC article.
-
Alternative splicing of clock transcript mediates the response of circadian clocks to temperature changes.bioRxiv [Preprint]. 2024 May 12:2024.05.10.593646. doi: 10.1101/2024.05.10.593646. bioRxiv. 2024. Update in: Proc Natl Acad Sci U S A. 2024 Dec 10;121(50):e2410680121. doi: 10.1073/pnas.2410680121. PMID: 38766142 Free PMC article. Updated. Preprint.
References
-
- Matlin AJ, Clark F, Smith CW. Understanding alternative splicing: towards a cellular code. Nat. Rev. Mol. Cell. Biol. 2005;6:386–398. - PubMed
-
- Blencowe BJ. Alternative splicing: new insights from global analyses. Cell. 2006;126:37–47. - PubMed
-
- Wang GS, Cooper TA. Splicing in disease: disruption of the splicing code and the decoding machinery. Nat. Rev. Genet. 2007;8:749–761. - PubMed
-
- Modrek B, Lee C. A genomic view of alternative splicing. Nat. Genet. 2002;30:13–19. - PubMed
Publication types
MeSH terms
Substances
LinkOut - more resources
Full Text Sources
Research Materials
Miscellaneous
