. 2010 Jul;116(1):113-21.
doi: 10.1093/toxsci/kfq104. Epub 2010 Apr 12.

Pulmonary responses to Stachybotrys chartarum and its toxins: mouse strain affects clearance and macrophage cytotoxicity

Affiliations

Pulmonary responses to Stachybotrys chartarum and its toxins: mouse strain affects clearance and macrophage cytotoxicity

Jamie H Rosenblum Lichtenstein et al. Toxicol Sci. 2010 Jul.

Abstract

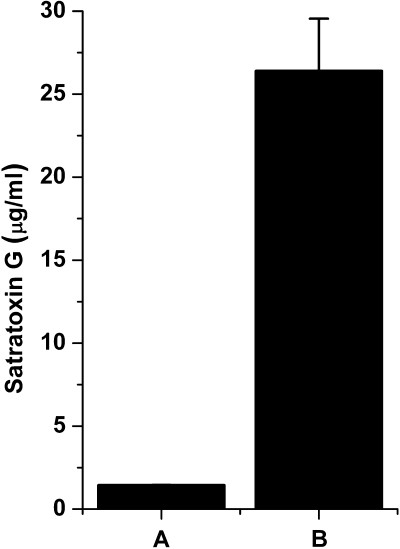
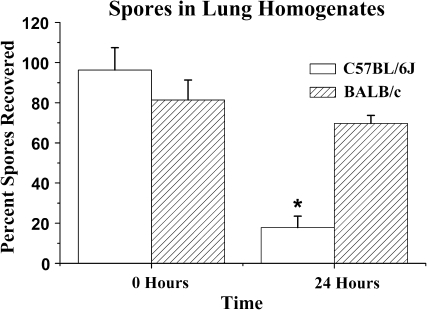
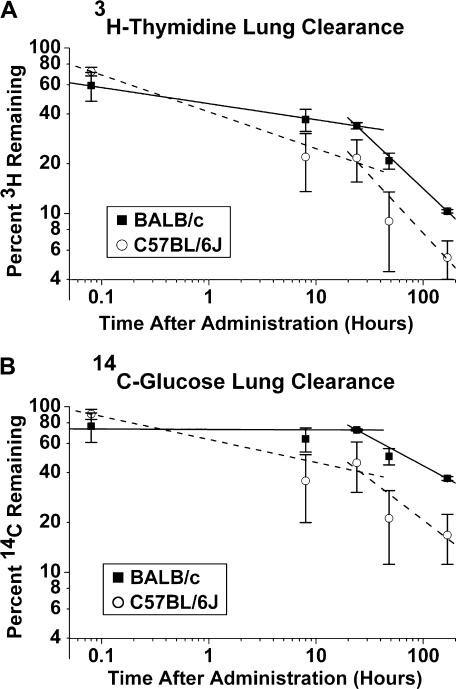
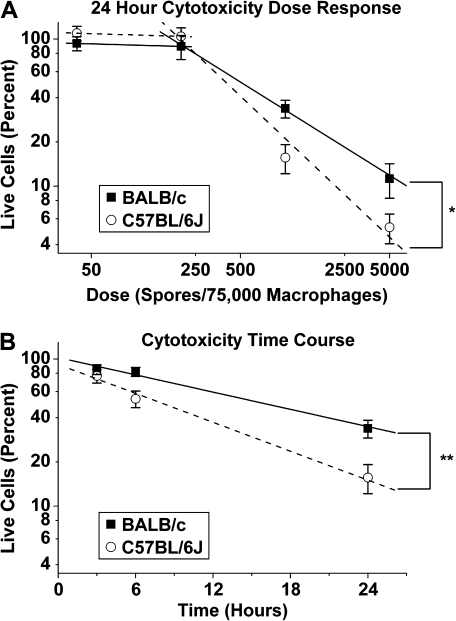
We investigated differences in the pulmonary and systemic clearance of Stachybotrys chartarum spores in two strains of mice, BALB/c and C57BL/6J. To evaluate clearance, mice were intratracheally instilled with a suspension of radiolabeled S. chartarum spores or with unlabeled spores. The lungs of C57BL/6J mice showed more rapid spore clearance than the lungs of BALB/c mice, which correlated with increased levels of spore-associated radioactivity in the GI tracts of C57BL/6J as compared with BALB/c mice. To identify mechanisms responsible for mouse strain differences in spore clearance and previously described lung inflammatory responses, we exposed alveolar macrophages (AMs) lavaged from BALB/c and C57BL/6J mice to S. chartarum spores, S. chartarum spore toxin (SST), and satratoxin G (SG) in vitro. The S. chartarum spores were found to be highly toxic with most cells from either mouse strain being killed within 24 h when exposed to a spore:cell ratio of 1:75. The spores were more lethal to AMs from C57BL/6J than those from BALB/c mice. In mice, the SST elicited many of the same inflammatory responses as the spores in vivo, including AM recruitment, pulmonary hemorrhage, and cytokine production. Our data suggest that differences in pulmonary spore clearance may contribute to the differences in pulmonary responses to S. chartarum between BALB/c and C57BL/6J mice. Enhanced AM survival and subsequent macrophage-mediated inflammation may also contribute to the higher susceptibility of BALB/c mice to S. chartarum pulmonary effects. Analogous genetic differences among humans may contribute to reported variable sensitivity to S. chartarum.


Figures

FIG. 1.
FIG. 1.
SST per spore characterization. SG equivalents as measured by ELISA in (A) 106 Stachybotrys chartarum spores/ml and (B) full strength SST preparation used in Figure 6. Data are mean ± SD.
FIG. 2.
FIG. 2.
Spores in lung homogenates. C57BL/6J mice clear more spores by 24 h than do BALB/c mice. Mean visible spores at 200× magnification in homogenized lungs ± SE versus time (hours). N = 5 mice/strain measured in two different experiments (ANOVA, *p = 0.02 for C57BL/6J vs. BALB/c).
FIG. 3.
FIG. 3.
Radiolabeled spore clearance in lungs. Both BALB/c and C57BL/6J mice clear radiolabeled spores from the lungs over 7 days (p = 0.04, repeated measures analysis). BALB/c mice appear to retain more spores and/or spore components in the lung, although this difference is not statistically significant (p = 0.08, repeated measures analysis). 3H is cleared faster than 14C (p = 0.0001, repeated measures analysis). N = 3–6 mice per time point and strain. (A) Mean percent of administered 3H-thymidine (log scale) detected in whole digested lung and trachea ± SE versus time (log scale) after IT administration (hours). The equation that best describes the clearance of 3H in BALB/c mice is log(y) = 1.64 − 0.20 log(x) (data are linear, p = 0.05) and for C57BL/6J mice it is log(y) = 1.57 – 0.32 log(x) (data are linear, p = 0.01). (B) Mean percent of administered 14C-glucose (log scale) detected in whole digested lung and trachea ± SE versus time (log scale) after administration (hours). For 14C, the equation that best describes the clearance in BALB/c mice is log(y) = 1.84 − 0.08 log(x) (error in data is too large to determine linearity, p = 0.14) and for C57BL/6J mice it is log(y) = 1.76 – 0.21 log(x) (data are linear, p = 0.03).
FIG. 4.
FIG. 4.
Radiolabeled spore detection in the GI tract. C57BL/6J mice clear significantly more spores from the lungs to the GI tract at 8 h. (A) Mean percent of intratracheal administered 3H-thymidine-labeled spores detected in digested esophagus, stomach, small intestines, cecum, and large intestines ± SE versus time after administration (hours). Strains significantly different at 8 h (*p = 0.05, MANOVA). (B) Mean percent of intratracheally administered spores labeled with 14C-glucose detected in digested esophagus, stomach, small intestines, cecum, and large intestines ± SE versus time after administration (hours). Strains significantly different at 8 h (**p = 0.04, MANOVA).
FIG. 5.
FIG. 5.
Spore cytotoxicity in vitro. Spores are significantly more cytotoxic to C57BL/6J AMs than to BALB/c AMs. A total of 75,000 cells were plated per well for all wells. Data are shown as mean ± SE. (A) Dose (spores per macrophage) verses live cells as a percent of baseline (baselines are calculated as the total number of live and dead cells in matched wells with no spores). Graph is on a log-log scale. Slopes from 0.0027 to 0.06667 spores per macrophage for C57BL/6J (0.97) are significantly different from BALB/c (0.68) (*p = 0.007, repeated measures analysis, broken stick model). (B) Time course of cytotoxicity at 0.0133 spores per macrophage dose. Time (hours) versus live cells as a percent of baseline (baselines are calculated as the total number of live and dead cells in matched wells with no spores). Percent is graphed on a log scale. Slope of C57BL/6J (0.098) is significantly different from BALB/c (0.086) (**p = 0.04, repeated measures analysis).
FIG. 6.
FIG. 6.
SST and SG cytotoxicity in vitro. SST and SG both cause a significant dose response in both strains of mice (p = 0.0001). SST and SG are significantly more cytotoxic to C57BL/6J AMs than to BALB/c AMs (*p = 0.02 and **p = 0.059 respectively)—75,000 live cells plated per well for all wells. Data are shown as mean ± SE. Graphs are on a log-log scale. (A) Dose (SST [μg/ml SG equivalents]) verses live cells as a percent of baseline (baselines are calculated as the total number of cells in matched wells with RPMI-1640). Slopes from 0.01–0.5 μg/ml SG equivalents of SST for C57BL/6J (–0.41) are significantly different from BALB/c (–0.23). (B) Dose (μg SG/ml RPMI 1640) verses live cells as a percent of baseline (baselines are calculated as the total number of live and dead cells in matched wells with no SST). Slopes from 0.03–0.7 μg/ml SG for C57BL/6J (–0.27) are significantly different from BALB/c (–0.18).

Similar articles

Cited by

References

    1. Andersen B, Nielsen KF, Jarvis BB. Characterization of Stachybotrys from water-damaged buildings based on morphology, growth, and metabolite production. Mycologia. 2002;94:392–403. - PubMed
    1. Andersen B, Nielsen KF, Thrane U, Szaro T, Taylor JW, Jarvis BB. Molecular and phenotypic descriptions of Stachybotrys chlorohalonata sp. nov. and two chemotypes of Stachybotrys chartarum found in water-damaged buildings. Mycologia. 2003;95:1227–1238. - PubMed
    1. Bae HK, Shinozuka J, Islam Z, Pestka JJ. Satratoxin G interaction with 40S and 60S ribosomal subunits precedes apoptosis in the macrophage. Toxicol. Appl. Pharmacol. 2009;237:137–145. - PMC - PubMed
    1. Chung YJ, Jarvis BB, Tak H, Pestka JJ. Immunochemical assay for satratoxin G and other macrocyclic trichothecenes associated with indoor air contamination by Stachybotrys chartarum. Toxicol. Mech. Meth. 2003a;13:247–252. - PubMed
    1. Chung YJ, Yang GH, Islam Z, Pestka JJ. Up-regulation of macrophage inflammatory protein-2 and complement 3A receptor by the trichothecenes deoxynivalenol and satratoxin G. Toxicology. 2003b;186:51–65. - PubMed

Publication types