

Up-regulation of the mu-opioid receptor gene is mediated through chromatin remodeling and transcriptional factors in differentiated neuronal cells
- PMID: 20385708
- PMCID: PMC2912061
- DOI: 10.1124/mol.110.064311
Up-regulation of the mu-opioid receptor gene is mediated through chromatin remodeling and transcriptional factors in differentiated neuronal cells
Abstract
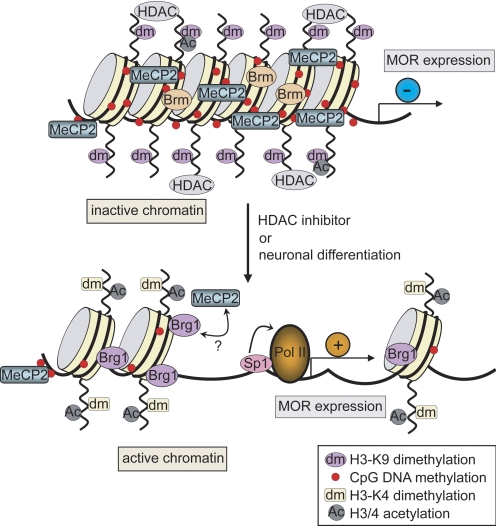
The effects of morphine are mediated mainly through the mu opioid receptor (MOR). Expression of the MOR is up-regulated during neuronal differentiation in P19 embryonal carcinoma cells and epigenetic changes play an important role in MOR up-regulation. This study investigates the basis for differentiation-dependent alterations of MOR chromatin by studying the recruitment or dissociation of several factors to the remodeled chromatin locus. Chromatin immunoprecipitation assays were used to demonstrate the recruitment of the transcriptional activator Sp1 and the chromatin remodeling factors Brg1 and BAF155 to this promoter, as well as the dissociation of repressors [histone deacetylases, mSin3A, Brm, and methyl-CpG-binding protein 2 (MeCP2)]. Histone modifications (acetylation, induction of histone H3-lys4 methylation, and reduction of H3-lys9 methylation) were consistently detected on this promoter. Overexpression of Sp1 strongly enhanced MOR promoter activity, and the histone deacetylase inhibitor trichostatin A also increased promoter activity. In vitro DNA CpG-methylation of the promoter partially blocked binding of the Sp1 factor but induced MeCP2 binding. Coimmunoprecipitation studies also found novel evidence of an endogenous MeCP2 interaction with Sp3 but a weaker interaction with Sp1. Overall, the results suggest that during neuronal differentiation, MeCP2 and DNA methylation mediate remodeling of the MOR promoter by chromatin remodeling factors (Brg1 and BAF155) from a compacted state to a conformation allowing access for transcriptional factors. Subsequent recruitment of the activating transcription factor Sp1 to the remodeled promoter results in MOR up-regulation.
Figures


Similar articles
-
Evidence of endogenous mu opioid receptor regulation by epigenetic control of the promoters.Mol Cell Biol. 2007 Jul;27(13):4720-36. doi: 10.1128/MCB.00073-07. Epub 2007 Apr 23. Mol Cell Biol. 2007. PMID: 17452465 Free PMC article.
-
Epigenetic programming of mu-opioid receptor gene in mouse brain is regulated by MeCP2 and Brg1 chromatin remodelling factor.J Cell Mol Med. 2009 Sep;13(9B):3591-615. doi: 10.1111/j.1582-4934.2008.00535.x. Epub 2008 Oct 13. J Cell Mol Med. 2009. PMID: 19602036 Free PMC article.
-
Effects of trichostatin A on neuronal mu-opioid receptor gene expression.Brain Res. 2008 Dec 30;1246:1-10. doi: 10.1016/j.brainres.2008.09.083. Epub 2008 Oct 11. Brain Res. 2008. PMID: 18950606 Free PMC article.
-
Transcriptional regulation of mouse mu opioid receptor gene: Sp3 isoforms (M1, M2) function as repressors in neuronal cells to regulate the mu opioid receptor gene.Mol Pharmacol. 2005 May;67(5):1674-83. doi: 10.1124/mol.104.008284. Epub 2005 Feb 9. Mol Pharmacol. 2005. PMID: 15703380
-
Dual mechanisms of regulation of transcription of luteinizing hormone receptor gene by nuclear orphan receptors and histone deacetylase complexes.J Steroid Biochem Mol Biol. 2003 Jun;85(2-5):401-14. doi: 10.1016/s0960-0760(03)00230-9. J Steroid Biochem Mol Biol. 2003. PMID: 12943729 Review.
Cited by
-
Stabilization of morphine tolerance with long-term dosing: association with selective upregulation of mu-opioid receptor splice variant mRNAs.Proc Natl Acad Sci U S A. 2015 Jan 6;112(1):279-84. doi: 10.1073/pnas.1419183112. Epub 2014 Dec 22. Proc Natl Acad Sci U S A. 2015. PMID: 25535370 Free PMC article.
-
Epigenetics of drug abuse: predisposition or response.Pharmacogenomics. 2012 Jul;13(10):1149-60. doi: 10.2217/pgs.12.94. Pharmacogenomics. 2012. PMID: 22909205 Free PMC article. Review.
-
Inhibition of c-Jun NH2-terminal kinase stimulates mu opioid receptor expression via p38 MAPK-mediated nuclear NF-κB activation in neuronal and non-neuronal cells.Biochim Biophys Acta. 2013 Jun;1833(6):1476-88. doi: 10.1016/j.bbamcr.2013.02.017. Epub 2013 Feb 26. Biochim Biophys Acta. 2013. PMID: 23485395 Free PMC article.
-
Histone deacetylase 2 is involved in µ‑opioid receptor suppression in the spinal dorsal horn in a rat model of chronic pancreatitis pain.Mol Med Rep. 2018 Feb;17(2):2803-2810. doi: 10.3892/mmr.2017.8245. Epub 2017 Dec 11. Mol Med Rep. 2018. PMID: 29257262 Free PMC article.
-
OPRM1 Methylation Contributes to Opioid Tolerance in Cancer Patients.J Pain. 2017 Sep;18(9):1046-1059. doi: 10.1016/j.jpain.2017.04.001. Epub 2017 Apr 27. J Pain. 2017. PMID: 28456745 Free PMC article. Clinical Trial.
References
-
- Anastasiou D, Krek W. (2006) SIRT1: linking adaptive cellular responses to aging-associated changes in organismal physiology. Physiology (Bethesda) 21:404–410 - PubMed
-
- Arden JR, Segredo V, Wang Z, Lameh J, Sadée W. (1995) Phosphorylation and agonist-specific intracellular trafficking of an epitope-tagged mu-opioid receptor expressed in HEK 293 cells. J Neurochem 65:1636–1645 - PubMed
-
- Berger SL. (2001) An embarrassment of niches: the many covalent modifications of histones in transcriptional regulation. Oncogene 20:3007–3013 - PubMed
-
- Carey M, Peterson CL, Smale ST. (2009) Transcriptional Regulation in Eukaryotes: Concepts, Strategies, and Techniques Cold Spring Harbor Laboratory Press, Cold Spring Harbor, NY
Publication types
MeSH terms
Substances
Grants and funding
- P50 DA011806/DA/NIDA NIH HHS/United States
- R56 DA000564/DA/NIDA NIH HHS/United States
- DA011190/DA/NIDA NIH HHS/United States
- K02 DA013926/DA/NIDA NIH HHS/United States
- R01 DA011190/DA/NIDA NIH HHS/United States
- K05 DA070554/DA/NIDA NIH HHS/United States
- DA001583/DA/NIDA NIH HHS/United States
- DA011806/DA/NIDA NIH HHS/United States
- DA000564/DA/NIDA NIH HHS/United States
- R01 DA000564/DA/NIDA NIH HHS/United States
- K05-DA0700554/DA/NIDA NIH HHS/United States
- R01 DA001583/DA/NIDA NIH HHS/United States
- DA013926/DA/NIDA NIH HHS/United States
LinkOut - more resources
Full Text Sources
Molecular Biology Databases
Research Materials
Miscellaneous
