. 2010 Jul;78(7):2946-55.
doi: 10.1128/IAI.01296-09. Epub 2010 Apr 12.

Milestones in progression of primary pneumonic plague in cynomolgus macaques

Affiliations

Milestones in progression of primary pneumonic plague in cynomolgus macaques

Frederick Koster et al. Infect Immun. 2010 Jul.

Abstract

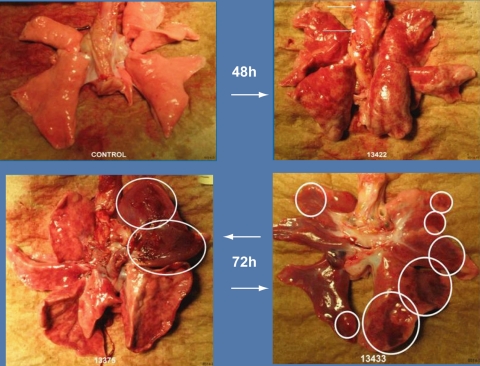
Vaccines against primary pneumonic plague, a potential bioweapon, must be tested for efficacy in well-characterized nonhuman primate models. Telemetered cynomolgus macaques (Macaca fascicularis) were challenged by the aerosol route with doses equivalent to approximately 100 50% effective doses of Yersinia pestis strain CO92 and necropsied at 24-h intervals postexposure (p.e.). Data for telemetered heart rates, respiratory rates, and increases in the temperature greater than the diurnal baseline values identified the onset of the systemic response at 55 to 60 h p.e. in all animals observed for at least 70 h p.e. Bacteremia was detected at 72 h p.e. by a Yersinia 16S rRNA-specific quantitative reverse transcription-PCR and was detected later by the culture method at the time of moribund necropsy. By 72 h p.e. multilobar pneumonia with diffuse septal inflammation consistent with early bacteremia was established, and all lung tissues had a high bacterial burden. The levels of cytokines or chemokines in serum were not significantly elevated at any time, and only the interleukin-1beta, CCL2, and CCL3 levels were elevated in lung tissue. Inhalational plague in the cynomolgus macaque inoculated by the aerosol route produces most clinical features of the human disease, and in addition the disease progression mimics the disease progression from the anti-inflammatory phase to the proinflammatory phase described for the murine model. Defined milestones of disease progression, particularly the onset of fever, tachypnea, and bacteremia, should be useful for evaluating the efficacy of candidate vaccines.


Figures

FIG. 1.
FIG. 1.
Bacterial culture of blood and tissue collected at scheduled necropsies (24, 48, and 72 h postchallenge) and after euthanasia of moribund macaques following aerosol exposure to Y. pestis. The results are expressed as log10CFU per gram of tissue or per milliliter of whole blood. Samples from three animals were analyzed for each time point for scheduled necropsies (24 h, 48 h, and 72 h), and three moribund animals were necropsied at 70 h, 92 h, and 94 h p.e. The bars indicate means for the three samples; the value for each sample was the mean for three replicate cultures (symbols). TBLN, tracheobronchial lymph nodes.
FIG. 2.
FIG. 2.
(Top panel) Sensitivity of the real-time RT-PCR assay specific for Y. pestis rRNA. (Bottom panel) Correlation of quantitative results of bacterial culture and RT-PCR analyses for tissue samples positive with both assays. The results for samples that were determined to be positive by only one assay are described in the text. The line was derived from the regression equation relating numbers of genome equivalents and CFU for each tissue sample collected from moribund animals.
FIG. 3.
FIG. 3.
Telemetery physiological data for two macaques that were moribund at 92 and 94 h p.e. The heart rates (HR) (top panel), respiratory rates (RR) (middle panel), and body temperatures (bottom panel) shown are 1-h averages for each animal. The baseline data are data for each animal averaged for each hour of the day over 4 days of preexposure recording. The baseline data for animal 24172 are data for 24-h periods showing diurnal variation; the baseline data for animal 13375 are similar to the baseline data for animal 24172 and are not shown. Data were compared to each animal's baseline diurnal variation results by using two-way ANOVA with repeated measures and Bonferroni posttests. The times when the values begin to be significantly different from the animal's baseline values are indicated by filled stars; arrows indicate the locations of the filled stars for clarity.
FIG. 4.
FIG. 4.
Cytokine and chemokine levels (means and standard deviations) for three samples each for serum (S), lung tissue with lesions (LL), and normal-appearing lungs (NL) collected at scheduled necropsies at 24 h, 48 h, and 72 h p.e. Three animals in the 96-h group were moribund at necropsy at 70 h, 92 h, and 94 h p.e.
FIG. 5.
FIG. 5.
Images of macaque lungs. (Upper left panel) Uninfected control. (Upper right panel) Lung 48 h after infection. The arrows indicate enlarged tracheobronchial lymph nodes, and the gray peripheral regions are due to an anesthesia artifact. (Lower panels) Lungs at 72 h p.e. Ellipses and circles indicate palpably firm nodules in lung parenchyma that were identified as lesion regions.
FIG. 6.
FIG. 6.
Histopathology in lung regions with gross abnormality (lesions [L]) and without gross abnormality (no lesions [NL]). (A) Normal-appearing lung with focal thickened alveolar septa (grade 1) at 48 h p.e. (B) Firm nodule (lesion) with hemorrhage and severe alveolitis (grade 4) at 72 h p.e. (C) Normal-appearing lung (no lesions) adjacent to tissue shown in panel B at 72 h p.e, with diffuse thickened alveolar septa (grade 2). (D) Normal-appearing lung (no lesions) at 96 h p.e., with congestion and alveolitis (grade 3). (E) Histopathological scores for lung tissues from 12 macaques. The “moribund” group included three animals that were euthanized because they were moribund at 70 h, 92 h, and 94 h p.e. “Inflammation alveolar” indicates predominantly polymorphonuclear leukocyte infiltration, while “inflammation mono” indicates mononuclear leukocyte infiltrate without neutrophils.

References

    1. Adamovicz, J. J., and P. L. Worsham. 2006. Plague, p. 107-135. In J. Swearengen (ed.), Biodefense research methodology and animal models. Taylor & Francis, Boca Raton, FL.
    1. Bosio, C. M., A. W. Goodyear, and S. W. Dow. 2005. Early interaction of Yersinia pestis with APCs in the lung. J. Immunol. 175:6750-6756. - PubMed
    1. Bubeck, S. S., A. M. Cantwell, and P. H. Dube. 2007. Delayed inflammatory response to primary pneumonic plague occurs in both outbred and inbred mice. Infect. Immun. 75:697-705. - PMC - PubMed
    1. Cheng, Y. S., H. Irshad, P. Kuehl, T. D. Holmes, R. Sherwood, and C. H. Hobbs. 2008. Lung deposition of droplet aerosols in monkeys. Inhal. Toxicol. 20:1029-1036. - PubMed
    1. Cohen, R. J., and J. L. Stockard. 1967. Pneumonic plague in an untreated plague-vaccinated individual. JAMA 202:365-366. - PubMed

Publication types

MeSH terms