. 2010 Jun;30(12):3086-98.
doi: 10.1128/MCB.01652-09. Epub 2010 Apr 12.

Semaphorin 3E initiates antiangiogenic signaling through plexin D1 by regulating Arf6 and R-Ras

Affiliations

Semaphorin 3E initiates antiangiogenic signaling through plexin D1 by regulating Arf6 and R-Ras

Atsuko Sakurai et al. Mol Cell Biol. 2010 Jun.

Abstract

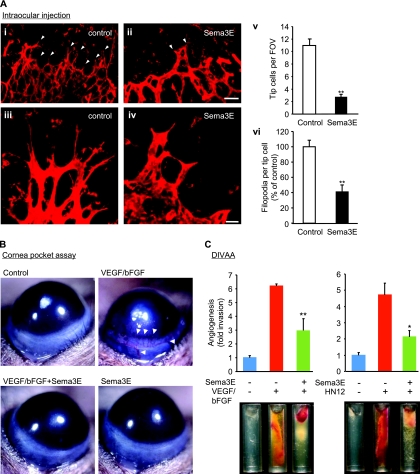
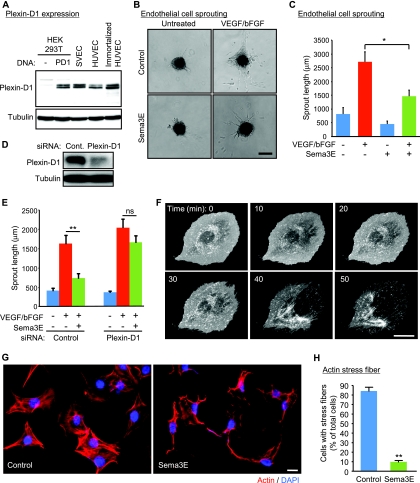
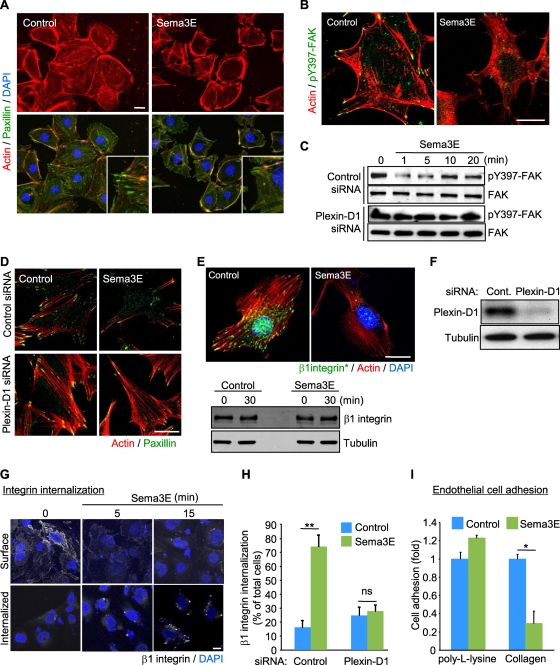
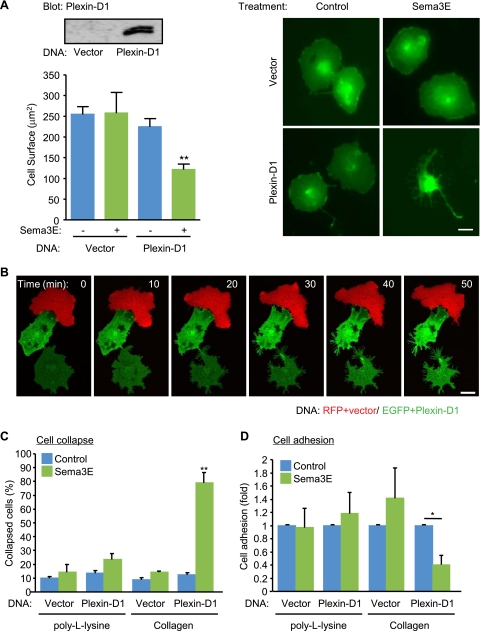
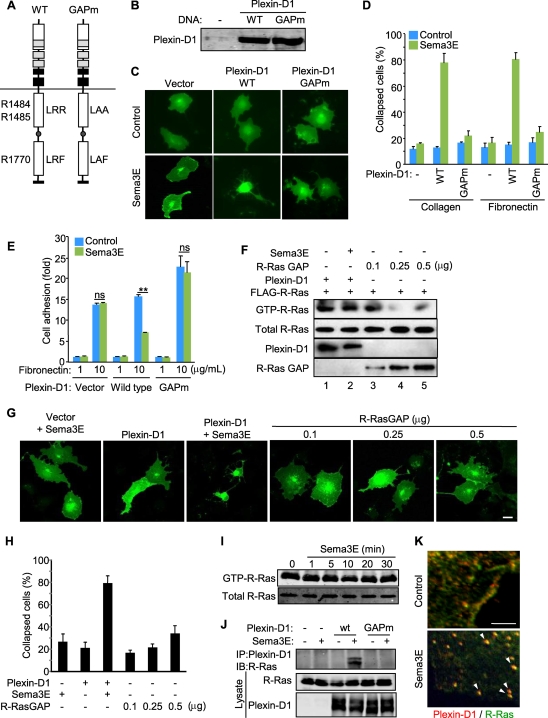
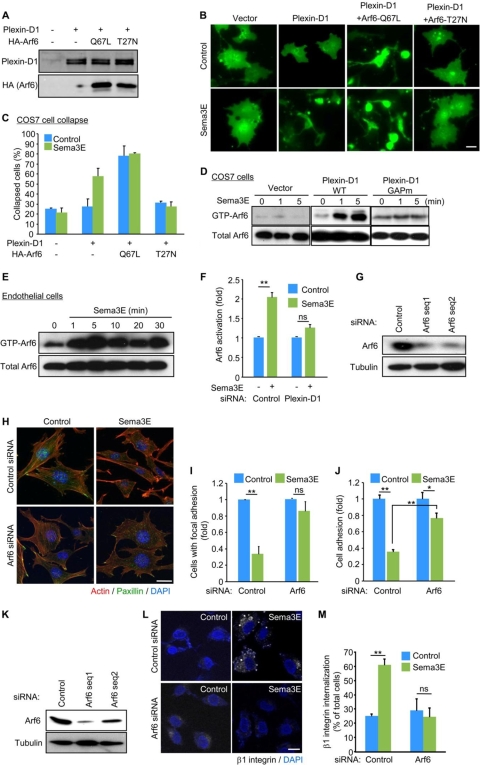
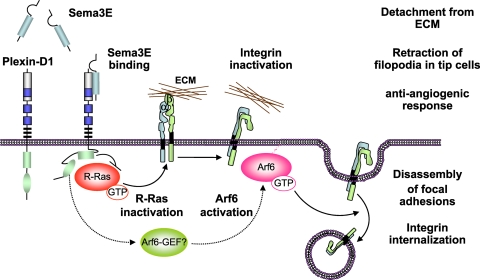
Recent studies revealed that a class III semaphorin, semaphorin 3E (Sema3E), acts through a single-pass transmembrane receptor, plexin D1, to provide a repulsive cue for plexin D1-expressing endothelial cells, thus providing a highly conserved and developmentally regulated signaling system guiding the growth of blood vessels. We show here that Sema3E acts as a potent inhibitor of adult and tumor-induced angiogenesis. Activation of plexin D1 by Sema3E causes the rapid disassembly of integrin-mediated adhesive structures, thereby inhibiting endothelial cell adhesion to the extracellular matrix (ECM) and causing the retraction of filopodia in endothelial tip cells. Sema3E acts on plexin D1 to initiate a two-pronged mechanism involving R-Ras inactivation and Arf6 stimulation, which affect the status of activation of integrins and their intracellular trafficking, respectively. Ultimately, our present study provides a molecular framework for antiangiogenesis signaling, thus impinging on a myriad of pathological conditions that are characterized by aberrant increase in neovessel formation, including cancer.


Figures

FIG. 1.
FIG. 1.
Sema3E inhibits angiogenesis in vivo. (A) Isolectin B4-stained retinal vasculature in control (i and iii) or 1 μg Sema3E-injected (ii and iv) P5 retinas. The number of filopodium-extending tip cells (arrowheads) was decreased in Sema3E-injected eyes. (iii and iv) Higher magnifications of tip cells show the retraction of filopodia in Sema3E-injected eyes. (v) The number of tip cells per field of view (FOV). The data shown are means plus standard errors of the mean (SEM); **, P < 0.01; n = 7. (vi) The number of filopodia per tip cell. The data shown are means plus SEM; **, P < 0.01; n = 11. (B) Cornea pocket assay. VEGF- and bFGF-induced blood vessel growth was inhibited by Sema3E. The images were taken on day 4 following implantation of pellets in the eyes of 10-week-old mice. (C) VEGF and bFGF (left) or highly angiogenic head and neck cancer cells (HN12 cells) (right) were mixed with basement membrane extract, either alone or in combination with Sema3E, and implanted into nude mice following the DIVAA protocol. Representative images of each experimental group are shown. Blood vessel invasion into the angioreactors is shown as fold increase over PBS control samples. The data shown are means plus SEM. n = 5; *, P < 0.05; **, P < 0.01. Scale bars, 50 μm (i and ii) and 20 μm (iii and iv).
FIG. 2.
FIG. 2.
Sema3E induces endothelial cell retraction. (A) Immunoblot analysis for plexin D1 in diverse endothelial cells. The lysates of plexin D1-transfected HEK-293T cells were used as a positive control. Tubulin was used as a loading control. (B) Spheroid-based three-dimensional in vitro angiogenesis assay. Endothelial cell spheroids were embedded in collagen gels and cultured in the presence of VEGF and bFGF, with or without Sema3E. A representative image of each experimental group is shown. Scale bar, 200 μm. (C) The cumulative length of all capillary-like sprouts originating from the central plain of an individual spheroid was measured. The data shown are means plus SEM; n = 10; *, P < 0.05. (D) siRNA-mediated knockdown of plexin D1 in SVECs. Plexin D1 protein levels were assessed 4 days later. Cont., control. (E) Control or plexin D1 siRNA-transfected cells were subjected to a sprouting assay as described for panels B and C. The data shown are means plus SEM; n = 10; **, P < 0.01; ns, no significant difference. (F) Sequential time-lapse images of the retraction of SVECs expressing RFP-CAAX upon Sema3E stimulation. Scale bar, 20 μm. (G) SVECs were treated with Sema3E for 2 h and stained for F-actin. Scale bar, 20 μm. Most cells showed a reduction in stress fibers after Sema3E treatment. (H) Quantification of panel E. The cells exhibiting actin stress fibers were counted. The data represent the percentages plus SEM. **, P < 0.01.
FIG. 3.
FIG. 3.
Sema3E negatively regulates cell-ECM adhesive interactions. (A and B) SVECs were serum starved, treated with Sema3E for 15 min, and stained for F-actin (red) and paxillin (green) (A) or phospho-FAK (pY397-FAK) (green) (B). Insets show higher magnifications of the corresponding images. (C) Control or plexin D1 siRNA-transfected SVECs were serum starved and treated with Sema3E, and total cell lysates were tested for pY397-FAK and total FAK. (D) siRNA-transfected SVECs were serum starved, treated with Sema3E, and stained for F-actin (red) and paxillin (green). (E) Serum-starved SVECs were treated with Sema3E for 30 min and stained for active β1-integrin (green) and F-actin (red) (top panel). The total amount of β1-integrin protein was unchanged (bottom panel). (F) siRNA-mediated knockdown of plexin D1 in HUVECs. Plexin D1 protein levels were assessed 4 days later. (G) HUVECs were incubated with mouse anti-β1-integrin to label cell surface β1-integrin and then incubated with Sema3E for the indicated periods. The cells were fixed immediately (Surface) or subjected to acid wash (Internalized) before fixation to remove membrane-bound antibodies, and β1-integrin was visualized by Alexa Fluor 488-conjugated anti-mouse IgG antibody. (H) Control or plexin D1 siRNA-transfected HUVECs were subjected to an integrin internalization assay as described for panel G. The internalized β1-integrin was visualized and quantified as described in Materials and Methods. Scale bars, 20 μm. The graphs represent means plus SEM of three independent experiments. ns, no significant difference; **, P < 0.01. (I) Adhesion of SVECs to a poly-l-lysine- or type I collagen-coated dish in the presence or absence of Sema3E was measured as described in Materials and Methods. The data shown are means plus SEM. *, P < 0.05. Scale bars, 20 μm.
FIG. 4.
FIG. 4.
Sema3E induces cell collapse via plexin D1 in an integrin-dependent fashion. (A) COS-7 cells were transfected with control or plexin D1-expressing plasmids, together with EGFP-CAAX, and the protein expression was analyzed by Western blotting with anti-plexin D1 antibody (upper left). The cells were serum starved and stimulated with Sema3E-containing conditioned medium for 30 min and fixed, and the cell surface area of EGFP-positive cells (n > 150) was measured. The graph shows the average cell surface area plus SEM from three independent experiments; **, P < 0.01. (B) Time-lapse images of Sema3E-stimulated COS-7 cells expressing the indicated plasmids. Only plexin D1-expressing cells collapsed upon simulation. (C) COS-7 cells were plated on poly-l-lysine- or type I collagen-coated dishes, and cell collapse was assessed as for panel A. EGFP-positive cells exhibiting a collapse phenotype were scored as a percentage of the total number of transfected cells. The data shown are means plus SEM of three independent experiments. **, P < 0.01. (D) COS-7 cells were transfected with control or plexin D1-expressing plasmids, and cell adhesion to poly-l-lysine- or type I collagen-coated dishes in the presence or absence of Sema3E was measured as described in Materials and Methods. The data represent means plus SEM. *, P < 0.05. Scale bars, 20 μm.
FIG. 5.
FIG. 5.
R-Ras inactivation is not sufficient for cytoskeletal collapse. (A) Schematic representation of the plexin D1 constructs. WT, wild type; GAPm, R-Ras GAP mutant. The numbers indicate amino acid residue positions in the domains. A, Ala; F, Phe; L, Leu; R, Arg. (B) Protein expression of plexin D1 constructs in COS-7 cells. (C and D) COS-7 cells were plated on type I collagen- or fibronectin-coated dishes and transfected with EGFP-CAAX and the indicated plexin D1-expressing plasmids. A collapse assay was performed as described for Fig. 4C. (E) COS-7 cells were transfected with the indicated plasmids and subjected to an adhesion assay as described for Fig. 4D. ns, no significant difference; **, P < 0.01. (F) COS-7 cells were transfected with the indicated plasmids, serum starved, and stimulated with Sema3E for 15 min. R-Ras activity was measured by GST pulldown assay as described in Materials and Methods. The cells expressing even relatively low levels of R-Ras GAP resulted in effective inactivation of R-Ras. (G and H) COS-7 cells were transfected with GFP-CAAX and plasmids as for panel G and subjected to a collapse assay as described for Fig. 4C. (I) HUVECs were serum starved and stimulated with Sema3E, and R-Ras activity was measured by GST pulldown assay. (J) COS-7 cells were transfected with FLAG-R-Ras- and plexin D1-expressing plasmids, serum starved, exposed to aluminum fluoride, and stimulated with Sema3E for 30 min, followed by immunoprecipitation (IP) and immunoblotting (IB) using the indicated antibodies. (K) Serum-starved HUVECs were treated with Sema3E for 5 min and stained for plexin D1 (red) and R-Ras (green). In control cells, plexin D1 and R-Ras are localized at the plasma membrane and likely in cytoplasmic membrane compartments but rapidly colocalize in an intracellular vesicular compartment upon Sema3E stimulation. The arrowheads indicate sites of colocalization. Scale bars, 20 μm.
FIG. 6.
FIG. 6.
Sema3E induces Arf6 activation in ECs. (A) Immunoblotting of plexin D1- and HA-tagged Arf6 in COS-7 cells. (B and C) COS-7 cells transfected with the indicated plasmids were subjected to a collapse assay as described for Fig. 4C. (D to F) COS7 cells transfected with control or plexin D1 vectors (D), SVECs (E), and plexin D1 siRNA-transfected SVECs (F) were serum starved and stimulated with Sema3E, and Arf6 activity was measured as described in Materials and Methods. GTP-Arf6 levels were normalized to the amount of total Arf6. (G to J) siRNA-mediated knockdown of Arf6 in SVECs. Arf6 protein levels were assessed 4 days later. (H) siRNA-transfected SVECs were serum starved, stimulated with Sema3E, and stained for F-actin (red) and paxillin (green). (I) The number of cells with FAs was scored as a percentage of the total cell number. (J) Adhesion of siRNA-transfected SVECs to fibronectin was measured as described for Fig. 3I. (K to M) siRNA-mediated knockdown of Arf6 in HUVECs. Arf6 protein levels were assessed 5 days later. (L) siRNA-transfected cells were subjected to an integrin internalization assay as described for Fig. 3G. (M) The internalized β1-integrin was visualized and quantified as described in Materials and Methods. Scale bars, 20 μm. The graphs represent means plus SEM of three independent experiments. ns, no significant difference; **, P < 0.01.
FIG. 7.
FIG. 7.
Schematic representation of the antiangiogenic Sema3E-plexin D1 signaling pathway in endothelial cells. The activation of plexin D1 by Sema3E induces the association of the Ras GAP domain of plexin D1 with R-Ras, thus sequestering R-Ras, and promotes the rapid activation of Arf6, likely by stimulating Arf6 GEFs. This results in the inactivation of integrins and their subsequent internalization, respectively, thus inhibiting endothelial cell adhesion to the ECM by disrupting integrin-mediated adhesive structures and causing filopodial retraction in endothelial tip cells. Ultimately, this two-pronged mechanism by which the Sema3E-plexin D1 signaling system acts may provide a repulsive cue for endothelial cells, thereby providing protection from the aberrant sprouting and growth of new blood vessels.

References

    1. Avraamides, C. J., B. Garmy-Susini, and J. A. Varner. 2008. Integrins in angiogenesis and lymphangiogenesis. Nat. Rev. Cancer. 8:604-617. - PMC - PubMed
    1. Basile, J. R., K. Holmbeck, T. H. Bugge, and J. S. Gutkind. 2007. MT1-MMP controls tumor-induced angiogenesis through the release of semaphorin 4D. J. Biol. Chem. 282:6899-6905. - PubMed
    1. Belperio, J. A., M. P. Keane, D. A. Arenberg, C. L. Addison, J. E. Ehlert, M. D. Burdick, and R. M. Strieter. 2000. CXC chemokines in angiogenesis. J. Leukoc. Biol. 68:1-8. - PubMed
    1. Cao, R., E. Brakenhielm, R. Pawliuk, D. Wariaro, M. J. Post, E. Wahlberg, P. Leboulch, and Y. Cao. 2003. Angiogenic synergism, vascular stability and improvement of hind-limb ischemia by a combination of PDGF-BB and FGF-2. Nat. Med. 9:604-613. - PubMed
    1. Carmeliet, P. 2005. Angiogenesis in life, disease and medicine. Nature 438:932-936. - PubMed

Publication types

MeSH terms