. 2010 Apr 19;189(2):353-67.
doi: 10.1083/jcb.200910136. Epub 2010 Apr 12.

I-BAR protein antagonism of endocytosis mediates directional sensing during guided cell migration

Affiliations

I-BAR protein antagonism of endocytosis mediates directional sensing during guided cell migration

Gabriel A Quinones et al. J Cell Biol. .

Abstract

Although directed cellular migration facilitates the coordinated movement of cells during development and repair, the mechanisms regulating such migration remain poorly understood. Missing-in-metastasis (MIM) is a defining member of the inverse Bin/Amphiphysin/Rvs domain (I-BAR) subfamily of lipid binding, cytoskeletal regulators whose levels are altered in a number of cancers. Here, we provide the first genetic evidence that an I-BAR protein regulates directed cell migration in vivo. Drosophila MIM (dmim) is involved in Drosophila border cell migration, with loss of dmim function resulting in a lack of directional movement by the border cell cluster. In vivo endocytosis assays combined with genetic analyses demonstrate that the dmim product regulates directed cell movement by inhibiting endocytosis and antagonizing the activities of the CD2-associated protein/cortactin complex in these cells. These studies demonstrate that DMIM antagonizes pro-endocytic components to facilitate polarity and localized guidance cue sensing during directional cell migration.


Figures
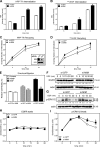
Figure 1.
Figure 1.
Vertebrate MIM loss of function results in increased endocytosis and reduced directional migration. (A and B) Quantification of the ratio of internalized to surface-bound Transferrin (A) of EGF (B) in ptc−/− MEFs treated with indicated siRNAs. Data are represented as the mean ± SEM from three separate experiments (*, P < 0.01; t test). (C and D) Quantification of the amount of recycled Transferrin (C) or EGF (D) in the medium of ptc−/− MEFs treated with indicated siRNAs. Data are represented as the mean ± SEM from three separate experiments. Inset in C shows immunoblots of protein level knockdown after treatment with indicated siRNAs. (E) MIM knockdown alters EGF-induced directional cell migration. Transwell migration assays showing alterations in the migration of ptc−/− MEFs through a permeable membrane in response to an EGF or PDGF gradient over the course of 8 h. Data are represented as the mean ± SEM from three separate experiments (*, P < 0.01; t test). (F) EGFR levels in siRNA-treated cells show that si-MIM–treated cells do not display enhanced degradation of the EGF receptor over time. (G) Phospho-ERK1 and 2 levels in cells treated with control or MIM siRNA. MIM knockdown results in prolonged levels of pERK1/2 after the addition of EGF to the cell medium. (H and I) Quantification of immunoblots used for F and G. Data are represented as the mean ± SEM from three separate experiments (*, P < 0.01; t test).
Figure 2.
Figure 2.
DMIM is the Drosophila homologue of human MIM. (A) The genomic structure of the dmim locus on chromosome 2R, 42C-42E, showing the transcriptional start (arrow) and exons encoding the I-BAR, scaffolding, and WH2 domains. The black box above indicates the exons (3–10) deleted by homologous recombination to make dmim-null flies. (B) Native gel of hMIM, DMIM, or DMIM mutant (4KA) I-BAR domains binding with lipids. Only when the I-BAR domain(s) bind to lipids will they run down the native gel. (C) hMIM, DMIM, or DMIM mutant (4KA) I-BAR domain cosedimented with PI(4,5)P2- or PI(3,4,5)P3-rich (30%) large multilamellar vesicles. Human and fly MIM display similar specificity in binding for specific lipids. (D) Overexpressing human or Drosophila MIM in Drosophila S2 cells results in similar changes in the actin cytoskeleton. Overexpression of either protein results in the formation of actin-based protrusions from the cell membrane. Bar = 20 µm.
Figure 3.
Figure 3.
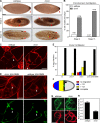
dmim-null flies display abnormal cell migration. (A) Immunohistochemistry of Drosophila embryos at different developmental stages stained with anti-VASA antibody to highlight the progress of germ cell migration. dmim mutants display retained germ cells outside of the embryo at stage 9 and mislocalized germ cells in the mesoderm at stage 15. Red arrowheads indicate the position of the primordial germ cells throughout each stage. Bar = 50 µm. (B) Quantification of germ cell migration from two different developmental stages where dmim mutants display an aberrant migration pattern. (C) dmim mutants are delayed in migration of the border cells in stage 10 egg chambers. The egg chambers are stained with phalloidin (F-actin, red). Bar = 50 µm. (D) Expression of a UAS-DMIM-Myc transgene under the 306-Gal4 driver shows expression of the construct in the border cells in both the dmim mutant and wild-type backgrounds. White arrowheads indicate the border cell cluster. Bar = 50 µm. (E) Quantification of border cell migration using the scale described in F; more than 100 egg chambers were examined per genotype. (F) Schematic of a stage 10 egg chamber and scale used to score border cell migration defects. Anterior is to the left. (G) Border cell stained for pTyr (green) and F-actin (red) indicating the portion of the cell membrane where active signaling is occurring. Bar = 5 µm. (H) Quantification of the ratio of posterior to anterior pixel staining with the pTyr antibody. Initial polarized pTyr has been shown to be crucial for proper border cell migration (Jékely et al., 2005).
Figure 4.
Figure 4.
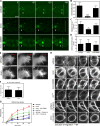
dmim mutants show border cell migration defects and altered endocytosis. (A) Time-lapse series of confocal micrographs of early stage 9 border cell clusters expressing UAS-GMA under 306-Gal4 in wild-type, dmim mutant, and dmim mutants expressing UAS-DMIM-Myc transgene in the border cells showing the migration of the border cell clusters over ∼3 h. White arrowheads indicate the border cell cluster and the dashed line indicates the anterior end of the oocyte (the end point of border cell migration). Bar = 50 µm. (B) Quantification of the directionality index (DI) of the border cell cluster. The DI is calculated as (A − B)/(A + B), where A is the number of forward extensions and B is the number of rearward extensions. Forward and rearward extensions are defined by which direction they point away from a vertical line on the dorsal ventral axis of the egg chamber. (C) Quantification of the migration speed of the border cell cluster, independent of the direction of migration. (D) Quantification of the average lifetime of each extension from the border cell cluster. All analyses were conducted using five separate movies for each genotype. (**, P < 0.001;***, P < 0.0001; t test). (E) Time-lapse series of confocal micrographs of individual border cells expressing UAS-GMA under 306-Gal4. Red arrowheads indicate tracking of a single cellular projection over time. Images were taken every 5 min, and the area shown is a magnification of the leading edge of a single border cell within a migrating cluster. (F) Quantification of the number of small surface projections in E. Data are represented as the mean ± SEM from 10 separate time series for each genotype. (G) Quantification of the amount of FM4-64 dye uptake over time for each indicated genotype. Data are represented as the mean ± SEM from five separate time series for each genotype. (H) Live confocal imaging of border cell clusters stained with the membrane-selective dye FM4-64. Each time series shows the gradual uptake and increase of the dye at the membrane of the border cells. Bar = 5 µm.
Figure 5.
Figure 5.
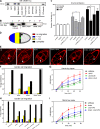
Loss of dcortactin or cindr rescues dmim border cell migration defects. (A) GST cosedimentation assay using candidate GST proteins and S2 cell-derived DMIM protein. DMIM binds to itself, human MIM, and DCortactin. (B) Immunoprecipitation assay using an antibody to endogenous DCortactin and lysates from Myc-tagged DMIM constructs. FL (full length DMIM); ΔI-BAR (lacking the IBAR domain); ΔPRD (lacking the polyproline-rich domain). (C) MIM or Cortactin knockdown alters EGF-induced directional cell migration. Transwell migration assays showing alterations in the migration of ptc−/− MEFs through a permeable membrane in response to an EGF or PDGF gradient over the course of 8 h. Data are represented as the mean ± SEM from three separate experiments (*, P < 0.01; **, P < 0.001; t test). (D) Schematic of a stage 10 egg chamber and scale used to score border cell migration defects. Anterior is to the left. (E) Confocal immunofluorescence images of egg chambers from wild-type, dmim, dcortactin, dmim; dcortactin, cindr RNAi, and dmim/cindr RNAi double-mutant egg chambers stained with phalloidin (F-actin, red). White arrowheads indicate the border cell cluster. Bar = 50 µm. (F and H) Quantification of stage 10 border cell migration for the indicated genotypes; more than 100 egg chambers were examined per genotype. (G and I) Quantification of the amount of FM4-64 dye uptake over time for each indicated genotype. Data are represented as the mean ± SEM from three separate time series for each genotype. Knockdown of dmim in combination with either dcortactin or cindr is able to partially rescue the increase in dye uptake seen in the dmim mutant border cells.
Figure 6.
Figure 6.
MIM regulates endocytosis by competing with CD2AP for cortactin binding. (A) Quantification of the ratio of internalized to surface-bound EGF at 0 and 15 min in ptc−/− MEFs treated with the indicated siRNAs. MIM knockdown shows an increase in EGF uptake, whereas cortactin or CD2AP knockdown shows a decrease in EGF uptake after 15 min. The combination of siRNAs against both MIM and cortactin or MIM and CD2AP restores the phenotype to wild-type levels at 15 min. The phenotype is not restored by simultaneous knockdown with clathrin heavy chain, dynamin, cbl, or endophilin. Data are represented as the mean ± SEM from three separate experiments (*, P < 0.01; t test). (B) Immunoblots indicating the level of protein knockdown after treatment with siRNAs for A. (C) Coimmunoprecipitations of CD2AP and endophilin with cortactin in si-GFP– or si-MIMtreated ptc−/− MEF lysate showing a decrease in the association of both proteins with cortactin after EGF stimulation. In the si-MIM–treated cells, a prolonged association of CD2AP and endophilin with cortactin is seen when compared with si-GFP–treated cells. (D) Direct competition between in vitro–translated CD2AP and bacterially expressed MIM for the SH3 domain of cortactin. MIM lacking the region that binds cortactin (MIM 1–277) is unable to compete with CD2AP for cortactin binding. (E) Coimmunoprecipitations of GFP-tagged endophilin or GFP-tagged MIM with cortactin in NIH 3T3 cells treated with increasing concentrations of EGF ligand. The interaction between endophilin and cortactin quickly increases within 5 min after stimulation with EGF, and subsequently dissociates within 30 min. The interaction between MIM and cortactin increases within 5 min, but persists strongly even 30 min after stimulation when compared with endophilin.

Similar articles

Cited by

References

    1. Bianco A., Poukkula M., Cliffe A., Mathieu J., Luque C.M., Fulga T.A., Rørth P. 2007. Two distinct modes of guidance signalling during collective migration of border cells. Nature. 448:362–365 10.1038/nature05965 - DOI - PubMed
    1. Blaser H., Eisenbeiss S., Neumann M., Reichman-Fried M., Thisse B., Thisse C., Raz E. 2005. Transition from non-motile behaviour to directed migration during early PGC development in zebrafish. J. Cell Sci. 118:4027–4038 10.1242/jcs.02522 - DOI - PubMed
    1. Bompard G., Sharp S.J., Freiss G., Machesky L.M. 2005. Involvement of Rac in actin cytoskeleton rearrangements induced by MIM-B. J. Cell Sci. 118:5393–5403 10.1242/jcs.02640 - DOI - PubMed
    1. Callahan C.A., Ofstad T., Horng L., Wang J.K., Zhen H.H., Coulombe P.A., Oro A.E. 2004. MIM/BEG4, a Sonic hedgehog-responsive gene that potentiates Gli-dependent transcription. Genes Dev. 18:2724–2729 10.1101/gad.1221804 - DOI - PMC - PubMed
    1. Dawson J.C., Legg J.A., Machesky L.M. 2006. Bar domain proteins: a role in tubulation, scission and actin assembly in clathrin-mediated endocytosis. Trends Cell Biol. 16:493–498 10.1016/j.tcb.2006.08.004 - DOI - PubMed

Publication types

MeSH terms