Meta-Analysis
. 2010 Apr 27;107(17):7853-7.
doi: 10.1073/pnas.0911249107. Epub 2010 Apr 12.

Contrasts between adaptive coding and noncoding changes during human evolution

Affiliations
Meta-Analysis

Contrasts between adaptive coding and noncoding changes during human evolution

Ralph Haygood et al. Proc Natl Acad Sci U S A. .

Abstract

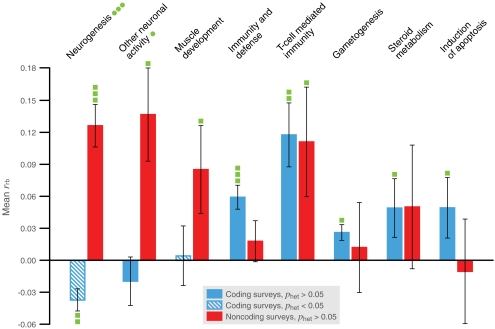
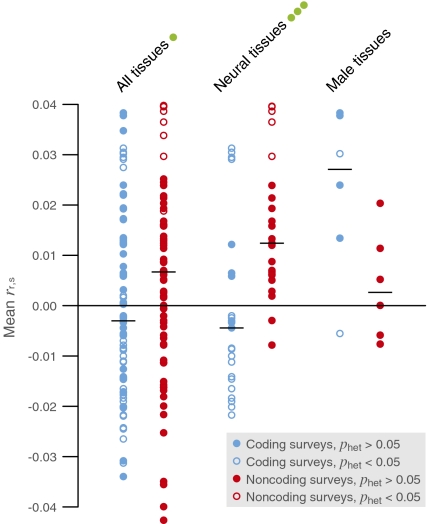
Changes in non-protein-coding regulatory DNA sequences have been proposed to play distinctive roles in adaptive evolution. We analyzed correlations between gene functions and evidence for positive selection in a common statistical framework across several large surveys of coding and noncoding sequences throughout the human genome. Strong correlations with both classifications in gene ontologies and measurements of gene expression indicate that neural development and function have adapted mainly through noncoding changes. In contrast, adaptation via coding changes is dominated by immunity, olfaction, and male reproduction. Genes with highly tissue-specific expression have undergone more adaptive coding changes, suggesting that pleiotropic constraints inhibit such changes in broadly expressed genes. In contrast, adaptive noncoding changes do not exhibit this pattern. Our findings underscore the probable importance of noncoding changes in the evolution of human traits, particularly cognitive traits.


Conflict of interest statement

The authors declare no conflict of interest.

Figures

Fig. 1.
Fig. 1.
Large PANTHER biological processes enriched with positive selection across coding or noncoding surveys. Plotted categories are all but three of those for which (i) the mean number of genes per survey is at least 50 across all surveys, (ii) the mean rank-biserial correlation (rrb) between score for positive selection and membership in the category is significantly positive (Penr < 0.05) across coding or noncoding surveys, and (iii) heterogeneity is nonsignificant (Phet > 0.05) across the same surveys. The three such categories not plotted are “ectoderm development,” “neuronal activities,” and “mesoderm development,” which are not significantly enriched when their respective subcategories “neurogenesis,” “other neuronal activity,” and “muscle development” are subtracted. Error bars represent SEM- rrb. Green blocks on error bars indicate one-tailed P values for the one-sample z test of mean rrb = 0. One block, 5 × 10⁻⁴ < P < 0.05; two blocks, 5 × 10⁻⁶ < P < 5 × 10⁻⁴; three blocks, P < 5 × 10⁻⁶. Similarly, green dots on category names indicate two-tailed P values for two-sample z tests of equal mean, rrb, across coding versus noncoding surveys.
Fig. 2.
Fig. 2.
Specificity and evenness scores. The vector represents expression of a given gene in two tissues. The dashed line corresponds to equal expression in these tissues. The specificity scores of the gene are s1 = cos2σ1 and s2 = cos2σ2. The gene’s expression is higher in tissue 1, so s1 > s2. The evenness score of the gene is e = cos2ε. If the gene’s expression were lower in tissue 1 or higher in tissue 2, then e would be greater.
Fig. 3.
Fig. 3.
Expression specificity and positive selection across coding and noncoding surveys. Neural tissues and male (reproductive) tissues are highlighted. Circles represent mean rank correlation (rr,s) between the score for positive selection and specificity to tissues in the Novartis Gene Expression Atlas. Horizontal lines indicate median of means. Green dots on group names indicate two-tailed P values for the Wilcoxon signed-rank test of equal median across coding versus noncoding surveys: one dot, 5 × 10⁻⁴ < P < 0.05; three dots, P < 5 × 10⁻⁶.

Similar articles

Cited by

References

    1. Hoekstra HE, Coyne JA. The locus of evolution: Evo devo and the genetics of adaptation. Evolution. 2007;61:995–1016. - PubMed
    1. Wray GA. The evolutionary significance of cis-regulatory mutations. Nat Rev Genet. 2007;8:206–216. - PubMed
    1. Stern DL. Evolutionary developmental biology and the problem of variation. Evolution. 2000;54:1079–1091. - PubMed
    1. Carroll SB. Evolution at two levels: On genes and form. PLoS Biol. 2005;3:1159–1166. - PMC - PubMed
    1. Carroll SB. Evo-devo and an expanding evolutionary synthesis: A genetic theory of morphological evolution. Cell. 2008;134:25–36. - PubMed

Publication types

Substances

LinkOut - more resources