. 2010 May 4;107(18):8063-70.
doi: 10.1073/pnas.1003530107. Epub 2010 Apr 12.

Global analysis of gene activity during Arabidopsis seed development and identification of seed-specific transcription factors

Affiliations

Global analysis of gene activity during Arabidopsis seed development and identification of seed-specific transcription factors

Brandon H Le et al. Proc Natl Acad Sci U S A. .

Abstract

Most of the transcription factors (TFs) responsible for controlling seed development are not yet known. To identify TF genes expressed at specific stages of seed development, including those unique to seeds, we used Affymetrix GeneChips to profile Arabidopsis genes active in seeds from fertilization through maturation and at other times of the plant life cycle. Seed gene sets were compared with those expressed in prefertilization ovules, germinating seedlings, and leaves, roots, stems, and floral buds of the mature plant. Most genes active in seeds are shared by all stages of seed development, although significant quantitative changes in gene activity occur. Each stage of seed development has a small gene set that is either specific at the level of the GeneChip or up-regulated with respect to genes active at other stages, including those that encode TFs. We identified 289 seed-specific genes, including 48 that encode TFs. Seven of the seed-specific TF genes are known regulators of seed development and include the LEAFY COTYLEDON (LEC) genes LEC1, LEC1-LIKE, LEC2, and FUS3. The rest represent different classes of TFs with unknown roles in seed development. Promoter-beta-glucuronidase (GUS) fusion experiments and seed mRNA localization GeneChip datasets showed that the seed-specific TF genes are active in different compartments and tissues of the seed at unique times of development. Collectively, these seed-specific TF genes should facilitate the identification of regulatory networks that are important for programming seed development.


Conflict of interest statement

The authors declare no conflict of interest.

Figures

Fig. 1.
Fig. 1.
Schematic representation of Arabidopsis seed development and stages of the life cycle used for GeneChip analysis. Seed cartoons were adapted from Bowman and Mansfield (57) and are not drawn to scale. Developmental events were modified from Goldberg et al. (1). Stages used for GeneChip analysis are described in SI Materials and Methods. Numbers correspond to days after pollination (DAP) or days after imbibition (DAI). Brackets mark the range of embryo stages included in each GeneChip seed sample. OV, unfertilized ovule; 24H, 24-h postpollination seed; GLOB, globular-stage seed; COT, cotyledon-stage seed; MG, mature-green-stage seed; PMG, postmature-green-stage seed; SDLG, seedling; L, leaf; R, root; S, stem; F, floral buds.
Fig. 2.
Fig. 2.
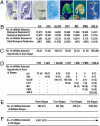
Genes active before, during, and after Arabidopsis seed development. (A) Bright-field (OV, 24H), Nomarski (GLOB, COT), and whole-mount (MG, PMG, SDLG) photographs of prefertilization ovule, seed stages, and postgermination seedling used for GeneChip analysis, respectively. OV and 24H seed samples were visualized from 10 μm stained paraffin sections (58). Insets show seeds used to dissect whole-mount MG and PMG embryos. Embryo in COT seed is at the linear cotyledon (LCOT) stage (Fig. 1). (B) Number of mRNAs detected at each stage of development. Numbers for biological replicates 1 and 2 indicate the number of probe sets with a MAS 5.0 detection call of P in each experiment (Materials and Methods). The number for both biological replicates indicates a consensus probe set detection call of PP and was used for subsequent analysis (Materials and Methods). Scatter plots and correlation coefficients comparing biological replicates are presented in Fig. S1. (C–F) Minimum number of specific and shared mRNAs at each developmental stage. The stringent filtering process used for these analyses is outlined in Materials and Methods. A total of 8,510 probe sets with INS (e.g., PA) or marginal (MM) consensus calls between biological replicates listed in B were removed across all developmental stages (SI Materials and Methods). The remaining probe sets were used to determine the number of stage-specific mRNAs (C) and mRNAs shared by two stages (D), three to six stages (E), or all stages (F). mRNAs (6,178 of the 6,937) shared by all stages (F) varied quantitatively across development (P < 0.05, ANOVA). Number in parentheses indicates TF mRNAs. The identities of mRNAs in each category (e.g., seed-stage-specific) are listed in Tables S3, S4, and S7 of Dataset S1. a, axis; c, cotyledon; cc, central cell; ec, egg cell; emb, embryo; hy, hypocotyl; r, roots; zy, zygote.
Fig. 3.
Fig. 3.
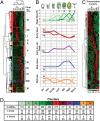
Quantitative regulation of mRNAs shared by all stages of seed development. (A) Unsupervised hierarchical clustering of GeneChip samples (Fig. 1) and probe sets with a consensus detection call of PP in all stages of development (Fig. 2F) was carried out by using dChip 1.3 (56) as described in Materials and Methods. Only the top 2,000 probe sets with the most varying signals across all stages were included in the clustering analysis (SI Materials and Methods). Numbered boxes highlight individual clusters of coregulated mRNAs. The identities of the top 2,000 mRNAs used for this clustering analysis and the mRNAs in each cluster are listed in Table S7 of Dataset S1. GO terms that are enriched significantly in each cluster (P < 0.01) are presented in Tables S8 and S9 of Dataset S1. (B) Graphical representation of cluster mRNA accumulation patterns. Lines represent the average mRNA accumulation pattern for all mRNAs in each cluster. (C) Unsupervised hierarchical clustering of 89 TF mRNAs included in the top 2,000 most varying probe sets shared by all stages of seed development (Fig. 2F) presented in A. The identities of TF mRNAs in each cluster are listed in Tables S7 and S9 of Dataset S1. (D) The number of mRNAs in each cluster shown in B and the number of mRNAs per cluster that increased significantly in prevalence ≥2-fold and ≥10-fold relative to the mean signal intensity of each cluster (P < 0.05). Scale from −3 (green) to +3 (red) represents the relative number of standard deviations from the mean signal intensity for each probe set across all developmental stages.
Fig. 4.
Fig. 4.
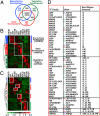
Identification of Arabidopsis seed-specific mRNAs. (A) GeneChip data obtained for all stages of the life cycle (Fig. 2 and Fig. S4) were partitioned into three groups: (i) reproductive development [OV and floral buds (FBUD) (blue circle)], (ii) seed development [(24H, GLOB, COT, MG, and PMG) (red circle)], and (iii) vegetative development [SDLG, leaf, stem, and root (green circle)]. Processing and filtering of the data are outlined in SI Materials and Methods. Number in parentheses indicates number of TF mRNAs. The identities of seed-specific, seed-specific TF, reproductive-organ-specific, and vegetative-organ-specific mRNAs are listed in Table S13 of Dataset S2. GO terms that are enriched significantly in the seed-, reproductive-, and vegetative-specific mRNA sets (P < 0.01) are presented in Table S15 of Dataset S2. Seed development accumulation patterns and representation of functional groups for the 289 seed-specific mRNAs are shown in Fig. S5. (B and C) Unsupervised hierarchical clustering of mRNAs (B) and TF mRNAs (C) shared by all periods of the life cycle [i.e., intersection of mRNA sets in A] was carried out by using dChip 1.3 (56) as described in SI Materials and Methods and Fig. 3A legend. Only the top 2,000 probe sets with the most varying signals across all periods of the life cycle were included in the clustering analysis shown in B (SI Materials and Methods). All 77 TF mRNAs included in the top 2,000 most varying probe sets shared by all life cycle periods (B) were used for the clustering analysis shown in C. Blue, red, and green bars highlight mRNA clusters that are up-regulated in (i) OV and 24H seeds, (ii) GLOB, COT, MG, and PMG seeds, and (iii) SDLG and vegetative organs, respectively. The number of mRNAs in each cluster that increased significantly in prevalence ≥2-fold relative to the mean signal intensity of each cluster (P < 0.05) is listed next to the bars in B. The identities of mRNAs shared throughout the life cycle (A) and those that are present in up-regulated clusters (B and C) are listed in Table S17 of Dataset S2. GO terms that are enriched significantly in each cluster (P < 0.01) are presented in Table S18 of Dataset S2. (D) TF families and stage specificity of seed-specific TF mRNAs identified in A. Seed-specific TF mRNAs were classified into families as shown in Fig. S5. Homozygous T-DNA insertion lines for TF genes marked with a * did not produce a detectable seed phenotype (green * by us and blue * by others) (Table S20 in Dataset S2). Mutations in seed-specific TF genes marked with a # were shown previously by us (e.g., lec 1, lec1-like, lec2, mea) and by others (e.g., pei1, fus3), to produce a seed-defective phenotype (Table S20 in Dataset S2). Scale from −3 (green) to +3 (red) represents the relative number of standard deviations from the mean signal intensity for each probe set across all developmental stages.
Fig. 5.
Fig. 5.
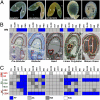
Seed-specific TF gene activity in different Arabidopsis seed compartments, regions, and tissues. (A) Localization of GUS enzyme activity in seeds and embryos of transgenic lines carrying different seed-specific TF gene upstream regions (Fig. 4D) fused with the GUS reporter gene (SI Materials and Methods). Squares in the horizontal bars below each GUS-stained embryo or seed show the GeneChip MAS 5.0 consensus call for the seed-specific TF gene in whole-mount seeds at different developmental stages (Fig. 2). Blue and gray squares represent consensus detection calls of PP and AA, respectively (see Materials and Methods). (B) Bright-field photographs of Arabidopsis 5–7 μm paraffin seed sections at different developmental stages. Highlighted areas represent compartments, regions, and tissues captured by LCM (32). (C) Seed-specific TF mRNA localization within seeds at different stages of development. Blue, light gray, and dark gray squares indicate GeneChip MAS 5.0 consensus detection calls of PP, AA, and INS, respectively (see Materials and Methods). White squares indicate not determined (N.D.). a, axis; c, cotyledon; cze, chalazal endosperm; czsc, chalazal seed coat; emb, embryo; ep, embryo proper; es, endosperm; gsc, general seed coat; mce, micropylar endosperm; pen, peripheral endosperm; sc, seed coat; sus, suspensor; PG, preglobular stage seed; HRT, heart-stage seed; LCOT, linear cotyledon-stage seed.

Similar articles

Cited by

References

    1. Goldberg RB, de Paiva G, Yadegari R. Plant embryogenesis: Zygote to seed. Science. 1994;266:605–614. - PubMed
    1. Raghavan V. Double Fertilization: Embryo and Endosperm Development in Flowering Plants. Berlin: Springer; 2006.
    1. Goldberg RB, Barker SJ, Perez-Grau L. Regulation of gene expression during plant embryogenesis. Cell. 1989;56:149–160. - PubMed
    1. Harada JJ. In: Seed maturation and the control of germination. Cellular and Molecular Biology of Seed Development, Advances in Cellular and Molecular Biology of Plants. Larkins BA, Vasil IK, editors. Vol. 4. Dordrecht, the Netherlands: Kluwer Academic Publishers; 1997. pp. 545–592.
    1. Baud S, Boutin J-P, Miquel M, Lepiniec L, Rochat C. Anintegrated overview of seed development in Arabidopsis thaliana ecotype WS. Plant Physiol Biochem. 2002;40:151–160.

Publication types

MeSH terms

Associated data