Rapid biocompatibility analysis of materials via in vivo fluorescence imaging of mouse models
- PMID: 20386609
- PMCID: PMC2850367
- DOI: 10.1371/journal.pone.0010032
Rapid biocompatibility analysis of materials via in vivo fluorescence imaging of mouse models
Abstract
Background: Many materials are unsuitable for medical use because of poor biocompatibility. Recently, advances in the high throughput synthesis of biomaterials has significantly increased the number of potential biomaterials, however current biocompatibility analysis methods are slow and require histological analysis.
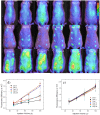
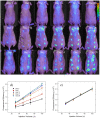
Methodology/principal findings: Here we develop rapid, non-invasive methods for in vivo quantification of the inflammatory response to implanted biomaterials. Materials were placed subcutaneously in an array format and monitored for host responses as per ISO 10993-6: 2001. Host cell activity in response to these materials was imaged kinetically, in vivo using fluorescent whole animal imaging. Data captured using whole animal imaging displayed similar temporal trends in cellular recruitment of phagocytes to the biomaterials compared to histological analysis.
Conclusions/significance: Histological analysis similarity validates this technique as a novel, rapid approach for screening biocompatibility of implanted materials. Through this technique there exists the possibility to rapidly screen large libraries of polymers in vivo.
Conflict of interest statement
Figures


References
-
- Weissleder R. Molecular Imaging in Cancer. Science. 2006;312:1168–1171. - PubMed
-
- Ntziachristos V, Ripoll J, Wang LV, Weissleder R. Looking and listening to light: The evolution of whole-body photonic imaging. Nature Biotechnology. 2005;23:313–320. - PubMed
-
- Weissleder R, Tung C-H, Mahmood T, Bogdanov A. In vivo imaging of tumors with protease-activated near-infrared fluorescence probes. Nature Biotechnology. 1999;17:375–378. - PubMed
-
- Helmlinger G, Yuan F, Dellian M, Jain RK. Interstitial pH and pO2 gradients in solid tumors in vivo: High-resolution measurements reveal a lack of correlation. Nature Medicine. 1997;3:177–182. - PubMed
Publication types
MeSH terms
Substances
LinkOut - more resources
Full Text Sources
Other Literature Sources
Medical

