. 2010 Apr 8;6(4):e1000736.
doi: 10.1371/journal.pcbi.1000736.

Dynamics and control of diseases in networks with community structure

Affiliations

Dynamics and control of diseases in networks with community structure

Marcel Salathé et al. PLoS Comput Biol. .

Abstract

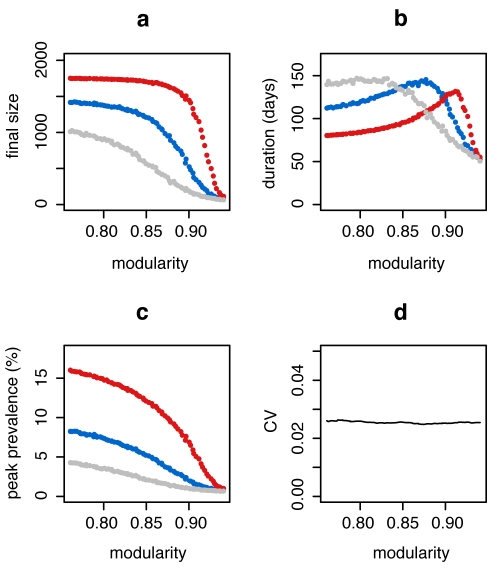
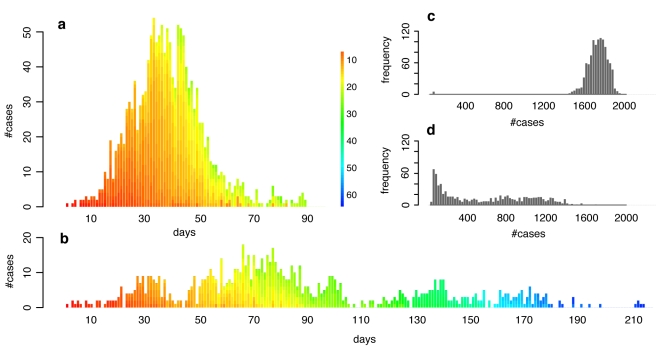
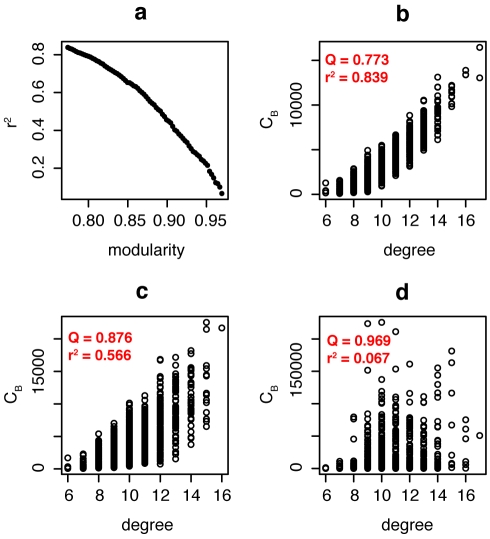
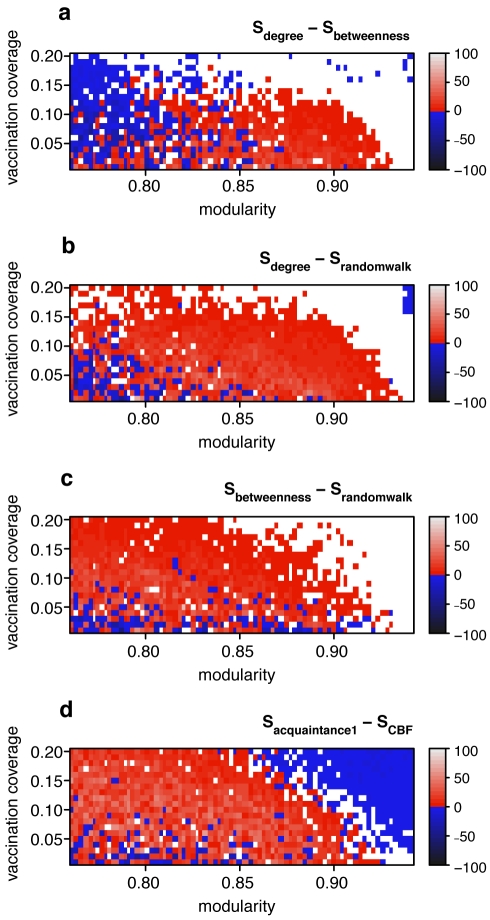
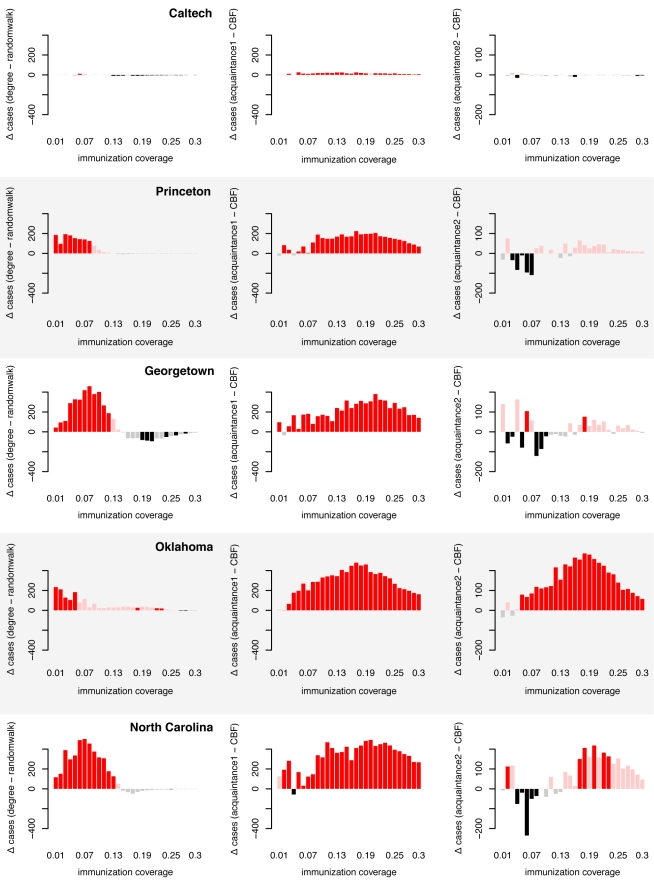
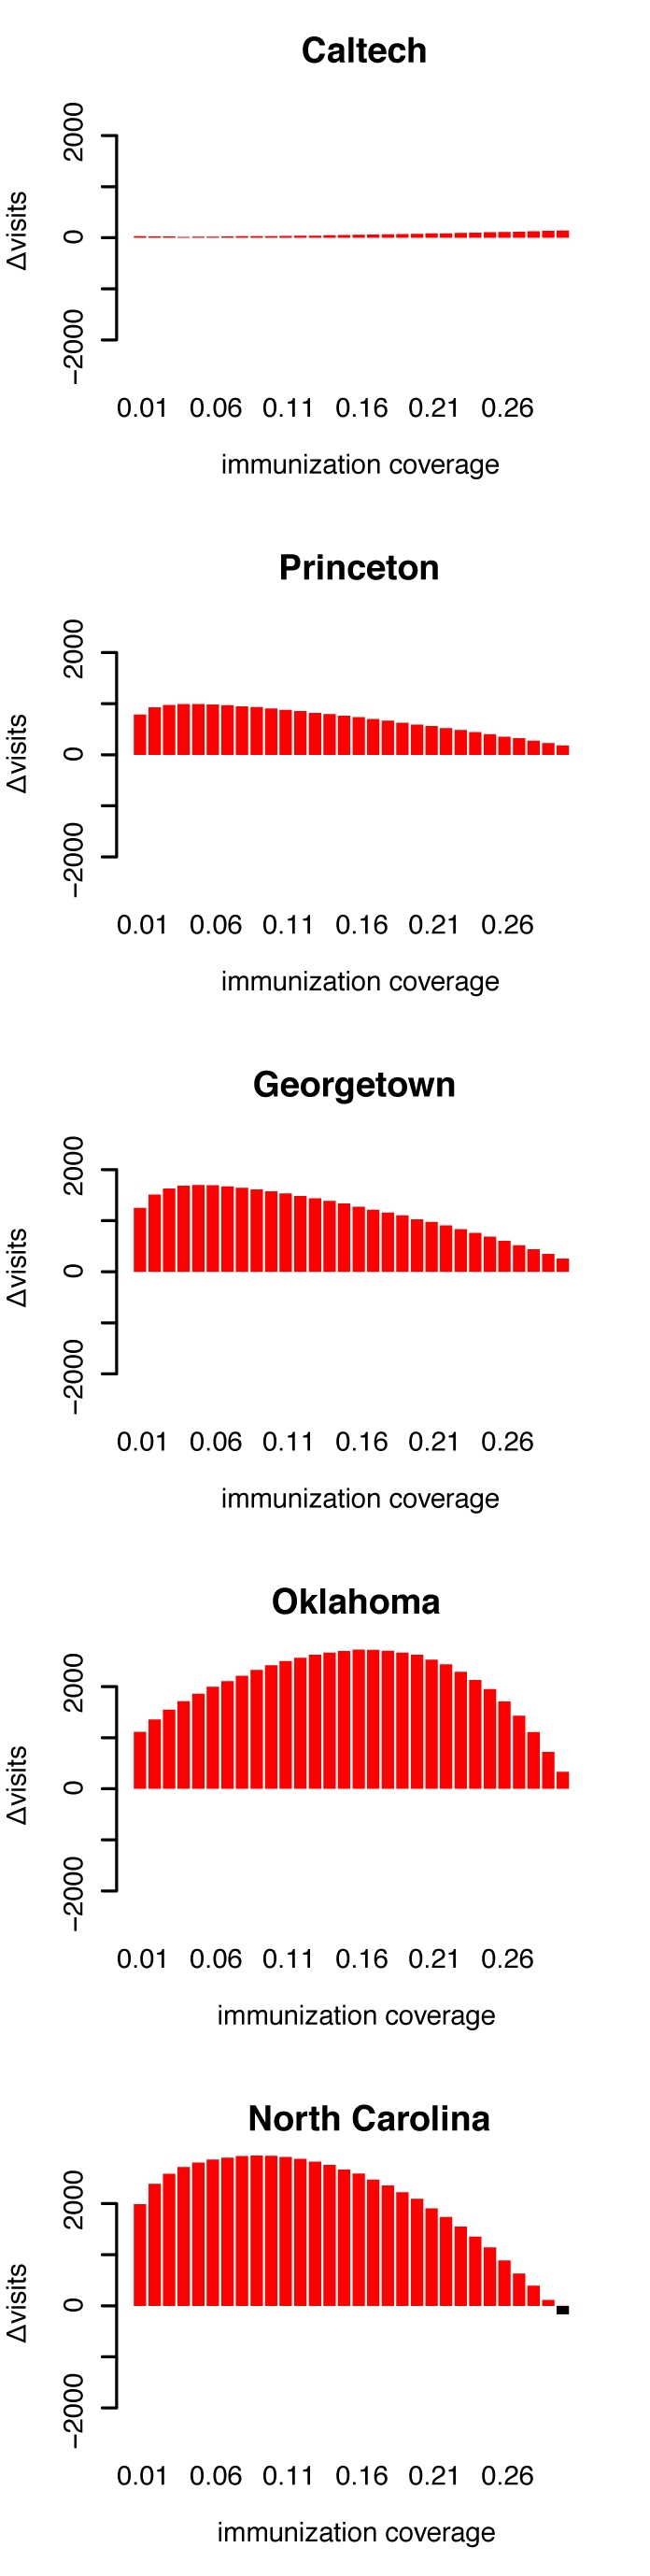
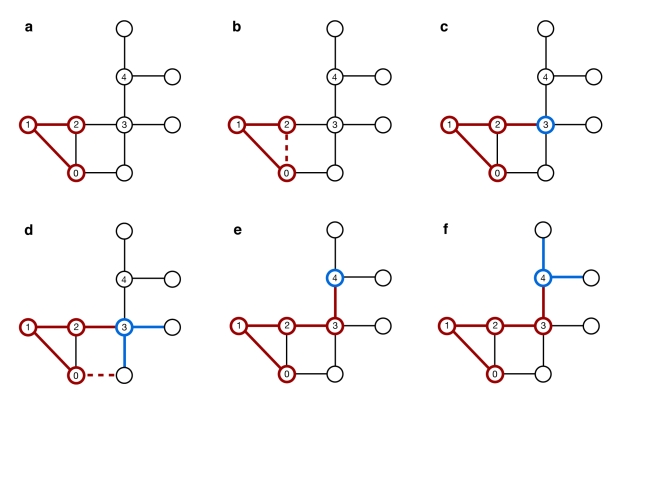
The dynamics of infectious diseases spread via direct person-to-person transmission (such as influenza, smallpox, HIV/AIDS, etc.) depends on the underlying host contact network. Human contact networks exhibit strong community structure. Understanding how such community structure affects epidemics may provide insights for preventing the spread of disease between communities by changing the structure of the contact network through pharmaceutical or non-pharmaceutical interventions. We use empirical and simulated networks to investigate the spread of disease in networks with community structure. We find that community structure has a major impact on disease dynamics, and we show that in networks with strong community structure, immunization interventions targeted at individuals bridging communities are more effective than those simply targeting highly connected individuals. Because the structure of relevant contact networks is generally not known, and vaccine supply is often limited, there is great need for efficient vaccination algorithms that do not require full knowledge of the network. We developed an algorithm that acts only on locally available network information and is able to quickly identify targets for successful immunization intervention. The algorithm generally outperforms existing algorithms when vaccine supply is limited, particularly in networks with strong community structure. Understanding the spread of infectious diseases and designing optimal control strategies is a major goal of public health. Social networks show marked patterns of community structure, and our results, based on empirical and simulated data, demonstrate that community structure strongly affects disease dynamics. These results have implications for the design of control strategies.


Conflict of interest statement

The authors have declared that no competing interests exist.

Figures

Figure 1
Figure 1. Effect of community structure, measured as modularity (Q) on epidemic dynamics.
Panels show effect of community structure on (a) final size, (b) duration and (c) peak prevalence (i.e. maximum frequency of population infected). Each of the points represents the average of maximally 2000 simulation runs (only simulations with a final size of at least 2% of the population were included in calculating the averages). Error bars are omitted because the ranges are less than the size of the plotting points. The different colors represent different transmission rates: gray, β = 0.05 (R02.5); blue, β = 0.06 (R03); red, β = 0.08 (R04). Panel (d) shows that the effect of a change in community structure on the squared coefficient of variation of the degree distribution (CV)2 is negligible.
Figure 2
Figure 2. Typical incidence curves and distributions of final size in networks with medium and strong community structure.
(a) and (b): Typical incidence curves of disease outbreaks in a network with medium community structure ((a): Q≈0.76) and a network with strong ((b): Q≈0.9) community structure (disease parameters equal to those in Figure 1 for the case where R03). Each stacked bar represents the cumulative number of new cases during a given day. The color of a single infection case denotes the infection generation (initial case = 0), i.e. the number of hosts through which the infection has been passed on before infecting the current case. (c) and (d): Distribution of final size of simulations of disease outbreaks in a network with medium ((c), same contact network as in (a)) and strong ((d), same contact network as in (b)) community structure. Note that only simulations with a final size of at least 2% of the population were included in the distributions.
Figure 3
Figure 3. The breakdown of the correlation between degree and betweenness centrality (CB) with increasing community structure.
(a) The correlation coefficient r2 decreases rapidly as modularity increases. (b–d): Correlation between degree and betweenness in network with (b) medium, (c) strong and (d) very strong community structure.
Figure 4
Figure 4. Assessing the efficacy of targeted immunization strategies based on deterministic and stochastic algorithms in the computationally generated networks.
Color code denotes the difference in the average final size Sm of disease outbreaks in networks that were immunized before the outbreak using method m. The top panel (a) shows the difference between the degree method and the betweenness centrality method, i.e. SdegreeSbetweenness. A positive difference (colored red to light gray) indicates that the betweenness centrality method resulted in smaller final sizes than the degree method. A negative difference (colored blue to black) indicates that the betweenness centrality method resulted in bigger final sizes than the degree method. If the difference is not bigger than 0.1% of the total population size, then no color is shown (white). Panel (a) shows that the betweenness centrality method is more effective than the degree based method in networks with strong community structure (Q is high). (b) and (c): like (a), but showing SdegreeSrandomwalk (in (b)) and SbetweennessSrandomwalk (in (c)). Panels (b) and (c) show that the random walk method is the most effective method overall. Panel (d) shows that the community bridge finder (CBF) method generally outperforms the acquaintance method (with n = 1) except when community structure is very strong (see main text). Final epidemic sizes were obtained by running 2000 SIR simulations per network, vaccination coverage and immunization method.
Figure 5
Figure 5. Assessing the efficacy of targeted immunization strategies in empirical networks based on deterministic and stochastic algorithms.
The bars show the difference in the average final size Sm of disease outbreaks (▵ cases) in networks that were immunized before the outbreak using method m. The left panels show the difference between the degree method and the random walk centrality method, i.e. SdegreeSrandomwalk. If the difference is positive (red bars), then the random walk centrality method resulted in smaller final sizes than the degree method. A negative value (black bars) means that the opposite is true. Shaded bars show non-significant differences (assessed at the 5% level using the Mann-Whitney test). The middle and right panels are generated using the same methodology, but measuring the difference between the acquaintance method (with n = 1 in the middle column and n = 2 in the right column, see Methods) and the community bridge finder (CBF) method, i.e. Sacquaintance1SCBF and Sacquaintance2SCBF. Again, positive red bars mean that the CBF method results in smaller final sizes, i.e. prevents more cases, than the acquaintance methods, whereas negative black bars mean the opposite. Final epidemic sizes were obtained by running 2000 SIR simulations per network, vaccination coverage and immunization method.
Figure 6
Figure 6. Assessing the speed of stochastic immunization algorithms acquaintance2 and CBF.
The speed of an algorithm is assessed by counting the nodes that have to be visited by the algorithm until the desired vaccination coverage is achieved. Each visit is counted, even if the same node has been visited before. The bars show the difference of node visits (▵ visits) between the acquaintance2 method and the CBF method. Red bars mean the CBF method has visited fewer nodes - the difference is given by the height of the bar. A black bar indicates that the acquaintance2 methods has visited fewer nodes. With the exception of vaccination coverage 30% in the North Carolina network, the CBF method is always faster. (Data for speed comparison between acquaintance1 and CBF is not shown - the acquaintance1 method is always faster, but significantly less effective - see middle column in Figure 5).
Figure 7
Figure 7. Sketch of the community bridge finder algorithm.
(a) A random walk follows the path starting from v0 to v1 and v2, at which point it starts checking for connections of v2 to v0 and v1. (b) Since there are more than one connections (v2-v1 and v2-v0), the walk continues to v3. (c) Except the obvious v3-v2, there are no connections from v3 to any of the previously visited nodes, so v2 is a potential target. (d) The algorithm then picks two random neighbors of v3 to check for connections to previously visited nodes - and finds one (to v0). (e) Hence, v2 is dismissed as a potential target, and the random walk continues to v4. Again, v4 does not back-connect to any previously visited node (except, of course, to v3), and thus v3 is identified as a potential target - (f) thus again, two random neighboring nodes are picked to check for connections to previously visited nodes. Since no back connections can be found, v3 is identified as a target and immunized.

Similar articles

Cited by

References

    1. Anderson RM, May RM. 1991. Infectious Diseases Of Humans, Dynamics and Control: Oxford Science Publications.
    1. Keeling MJ, Rohani P. 2008. Modeling Infectious Diseases in Humans and Animals: Princeton University Press.
    1. Diekmann O, Heesterbeek JAP. 2000. Mathematical Epidemiology of Infectious Diseases; Levin S, editor: John Wiley & Sons, Ltd.
    1. Anderson RM. Holmes K, editor. Transmission dynamics of sexually transmitted infections. 1999. pp. 25–37. Sexually Transmitted Diseases: McGraw-Hill.
    1. Morris M. Epidemiology and Social Networks - Modeling Structured Diffusion. Sociol Method Res. 1993;22:99–126.

Publication types

MeSH terms